Under-Canopy Lighting:
Under-Canopy-Lighting: Ist die Optimierung der Lichtverteilung im Bestand einer hohen Toplight-Intensität überlegen?
Under-Canopy Lighting: Is optimising the light distribution within the canopy superior to a high top-light intensity?
1. Introduction
In the commercial, controlled cultivation of cannabis, the efficient distribution of light within dense plant canopies is one of the central challenges. Because of high planting densities and the tendency of many genotypes toward vigorous height growth (often 1–1.5 m), very dense canopies typically develop. Conventional lighting mounted above the plants (top-lights) causes the upper region of the canopy to reach photosynthetically active photon flux densities (PPFD values) that lie close to the light saturation point of the leaves in this canopy layer. Depending on the top-light intensity, not only the potential light stress (photoinhibition) increases, but also the light reflection from the leaves and the photorespiratory carbon losses in the upper leaf layers, which represents a loss of efficiency in the plants' use of light. In addition, a significant proportion of the supplied light is already intercepted by the uppermost leaf layer, leading to a drastic light gradient within the canopy. In practice, often only about 25–30 % of the leaves receive the amount of light required for efficient photosynthesis and thus for optimal plant growth. When the light intensity falls below the so-called light compensation point (approx. 70–120 µmol m⁻² s⁻¹), the leaves in this region cease the net production of sugars. In this state they consume more energy for their maintenance than they generate through photosynthesis, thereby withdrawing resources from the plant that would otherwise be available for the development of flowers, cannabinoids and terpenes. Accordingly, the whole-plant potential in terms of the possible photosynthetic performance — and thus the yield potential — is not fully exploited.
Furthermore, the flowers in the middle and lower region of the canopy usually exhibit reduced quality, both in terms of their structure ("popcorn buds") and in terms of the accumulation of secondary plant metabolites (cannabinoids, terpenes, anthocyanins, flavonoids, etc.). Previous strategies for coping with this problem, such as intensive defoliation and pruning, are not only labour-intensive but can also expose the plants to abiotic stress and increase the risk of disease infection. Moreover, reducing the photosynthetically active leaf area means that the total possible photosynthetic potential of the plant or the canopy is not fully exploited. As a result, the flower yields achieved are usually well below the potentially achievable yields.
Against this background, under-canopy lighting (UCL) offers an innovative approach. By placing light sources directly beneath the canopy, the vertical light gradient is minimised. Scientific studies have also confirmed that the underside of the leaf (abaxial side) can use light for photosynthesis just as efficiently as the upper side, provided the light intensity is sufficiently high. In addition, leaf insertion angles are varied in response to changing irradiation angles in order to maximise radiation capture. The present study investigates the potential of under-canopy lighting to create a more uniform light environment, to standardise flower quality across the entire plant, and to increase operational efficiency by reducing the required manual maintenance measures. The following hypotheses were formulated before the start of the experiment:
- Despite the high light intensity provided by the top-light, light penetration in closed cannabis canopies is very low due to strong self-shading by planophile (horizontally oriented) leaves. Consequently, the radiation-use efficiency is not optimal, because the photosynthetic rate does not reach its maximum capacity for a large proportion of the total number of leaves.
- Reducing the light intensity in the upper region while simultaneously supplying light to the lower and middle parts of the canopy spatially homogenises the light intensity, enlarges the photosynthetically active leaf area, reduces light loss through reflection at the leaves as well as carbon losses through photorespiration, and ultimately maximises the photosynthetic performance of the entire canopy. This leads to higher flower yields, more homogeneous flower structures, and a standardisation of secondary-metabolite accumulation along the plant.
- Early establishment of UCL leads to a change in plant morphology by altering plant height, internode spacing, node number, leaf angles and branching angles. Combined with the expected structural changes at the leaf level (a greater number of palisade parenchyma layers in the leaf, resulting in an increased potential CO2 assimilation rate in the middle and lower canopy layers), the improved spatial distribution of leaf area leads to reduced effort in terms of common cultivation methods (e.g. defoliation). Because less plant material has to be removed and the existing leaf material works highly efficiently, we approach the yield potential of the plant.
- The microclimate within the canopy does not benefit from the lighting beneath the canopy, because increased transpiration rates occur in the lower region of the canopy, which leads to a higher relative humidity inside the canopy. This lowers the local VPD and can cause problems with the transport of relevant nutrients via the xylem, as well as increasing the mould risk for the inflorescences in the middle and lower canopy layers. Consequently, ventilation of the canopy could become more complex in order to fully exploit the potential of UCL.
2. Materials and Methods
2.1 Plant Material and Cultivation Conditions
The experiment was carried out under controlled conditions in the company's own plant laboratories at SANlight GmbH (Schruns, Austria). In order to be able to draw more generally valid conclusions regarding the potential treatment effects on the growth and development of Cannabis sativa L., the use of genetically identical clones was deliberately avoided and a population-based approach was chosen. The required young plants were therefore raised from seed. The choice fell on seeds of the variety (cv.) Seriotica® (Serious Seeds B.V., Purmerend, Netherlands). The variety is characterised by its compact and robust growth structure as well as good resistance to grey mould and powdery mildew. For germination, EazyPlugs were saturated with water and the seeds were then placed into the pre-formed hole and lightly pressed in. When inserting the seed, care was taken that the hilum (navel) pointed upward in each case so as not to impede germination. After sowing, the EazyPlug trays were placed in propagators whose trays were filled with a thin layer of moist perlite. To ensure a humidity of at least 80 % during germination, the plugs were sprayed with water once or twice daily. The germination temperature was approximately 26–27 °C. To avoid etiolation of the seedlings during/after germination, the two propagators were illuminated during the germination process and the establishment of the seedlings (approx. 3 days, until the cotyledons were fully developed and the first signs of the first true leaf pair were visible) using four Flex II-25 fixtures (SANlight GmbH, Schruns, Austria).
Canna Terra Professional Plus® (CANNA International N.V., Brussels, Belgium) was used as the growing substrate. Before the substrate was used, it was sterilised at 80 °C in order to neutralise any plant pathogens and pest insects it might contain. The pots ultimately used for the cultivation cycle (pot volume: 11 L) were then filled and compacted with 3.24 kg of the substrate using a standardised procedure, so that comparable substrate bulk densities — and thus uniform conditions in terms of water-holding capacity and capillarity — prevailed in every pot. One day before planting, the pots already filled with substrate were saturated with water to 72 % of field capacity using a mild nutrient solution (EC: 0.7, cf. Table 3) (cf. Figure 1).
Once the developmental stage of germination described above had been reached, the seedlings were transferred directly into the experimental environment (the plant laboratories of SANlight GmbH) and planted into the 11 L pots ultimately used. To ensure a good connection between the root ball and the growing substrate, an additional manual watering of 250 ml of water per pot was carried out after planting. The substrate thus had a water content of approximately 75 % of field capacity after planting.
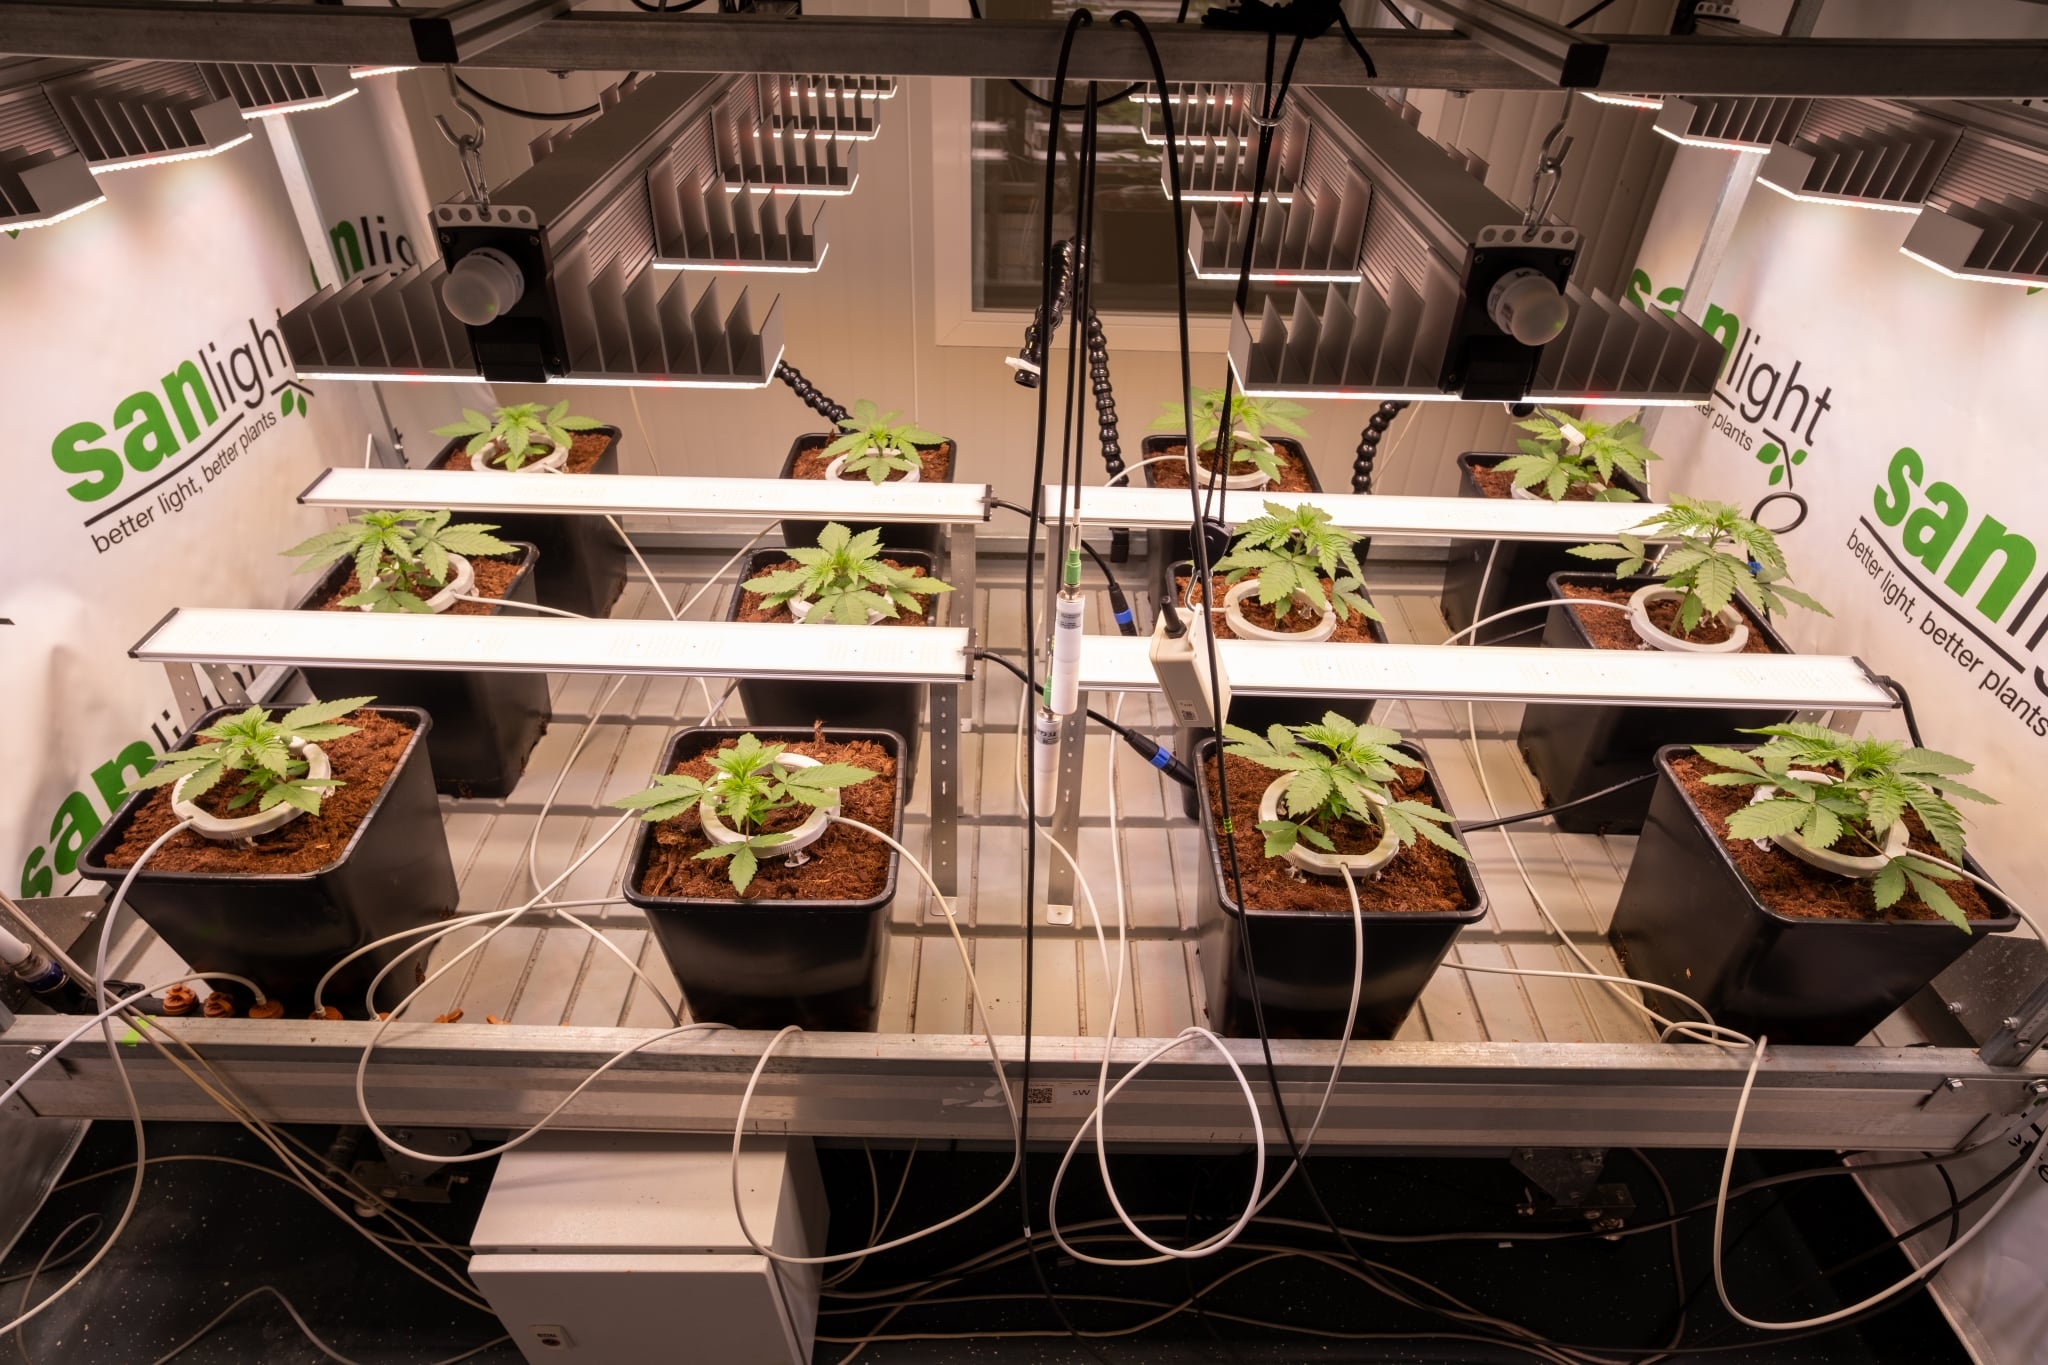
The experimental area comprised 12 tables with an area of 2 m2 (2 m × 1 m), whereby in the further course each table corresponded to one experimental treatment (cf. Section 2.3). Each of the 12 tables was evenly stocked with 12 plants or pots (3 rows of 4 plants each), resulting in a planting density of 6 plants per m2 (cf. Figure 2). The plants were illuminated from above by 4 EVO 5-120 1.5 fixtures (SANlight GmbH, Schruns, Austria) per table. To minimise the transplant shock until the formation of the first true leaf pair (duration 3 days), the climate conditions of the experimental environment were set to a daytime temperature of 24 °C and a relative humidity (rH) of 80 % (cf. Tables 1 and 2). During the photoperiod, set at 18 h, the photosynthetically active photon flux density (PPFD) — i.e. the light intensity — in this pre-vegetative phase was 180 µmol m-2 s-1.
In the further course of the experiment, the experiment was fundamentally grouped according to the cumulative photosynthetic photon flux (PPF) at the table level in the generative phase. The light and climate setpoints applied over the course of the entire cultivation cycle can be found in Tables 1 and 2, whereby the light settings shown correspond to the respective "top-light-only" control tables of the experiment carried out.
| Phase | Light and climate – setpoints (medium table PPF value in the generative phase) | |||||||
|---|---|---|---|---|---|---|---|---|
| Photo-period (h) | EVO top-light PPFD (µmol m-2 s-1) | Dimming level (%) | Plant spacing (cm) | Temperature [day/night] (°C) | rH [day/night] (%) | CO2 (ppm) | Air circulation (%) | |
| Pre-vegetative | ||||||||
| Day 1-3 | 18 | 180 | 21.0 | 90 | 24.0 / 22.0 | 80 / 70 | 480 | 50 |
| Vegetative | ||||||||
| Week 1 | 18 | 330 | 25.5 | 40 | 25.0 / 23.0 | 66 / 60 | 480 | 50 |
| Week 2 | 18 | 450 | 34.5 | 40 | 25.5 / 23.5 | 64 / 60 | 480 | 50 |
| Week 3 | 18 | 520 | 39.5 | 40 | 26.0 / 24.0 | 62 / 58 | 480 | 50 |
| Generative | ||||||||
| Week 1 | 12 | 903 | 72.0 | 40 | 27.0 / 25.0 | 59 / 55 | 480 | 75 |
| Week 2 | 12 | 903 | 72.0 | 40 | 28.0 / 25.0 | 55 / 51 | 480 | 75 |
| Week 3 | 12 | 903 | 72.0 | 40 | 28.0 / 25.0 | 52 / 50 | 480 | 85 |
| Week 4 | 12 | 903 | 72.0 | 40 | 29.0 / 25.0 | 52 / 50 | 480 | 100 |
| Week 5 | 12 | 903 | 72.0 | 40 | 30.0 / 26.0 | 50 / 50 | 480 | 100 |
| Week 6 | 12 | 903 | 72.0 | 40 | 30.0 / 26.0 | 50 / 50 | 480 | 100 |
| Week 7 | 12 | 903 | 72.0 | 40 | 30.0 / 26.0 | 50 / 50 | 480 | 100 |
| Week 8 | 12 | 903 | 72.0 | 40 | 29.0 / 25.0 | 50 / 50 | 480 | 100 |
| Week 9 | 12 | 903 | 72.0 | 40 | 28.0 / 23.0 | 50 / 50 | 480 | 100 |
| Week 10 | 12 | 903 | 72.0 | 40 | 26.0 / 20.0 | 50 / 50 | 480 | 100 |
| Week 11 | 12 | 903 | 72.0 | 40 | 25.0 / 19.0 | 50 / 50 | 480 | 100 |
| Phase | Light and climate – setpoints (high table PPF value in the generative phase) | |||||||
|---|---|---|---|---|---|---|---|---|
| Photo-period (h) | EVO top-light PPFD (µmol m-2 s-1) | Dimming level (%) | Plant spacing (cm) | Temperature [day/night] (°C) | rH [day/night] (%) | CO2 (ppm) | Air circulation (%) | |
| Pre-vegetative | ||||||||
| Day 1-3 | 18 | 180 | 21.0 | 90 | 24.0 / 22.0 | 80 / 70 | 480 | 50 |
| Vegetative | ||||||||
| Week 1 | 18 | 330 | 25.5 | 40 | 25.0 / 23.0 | 66 / 60 | 480 | 50 |
| Week 2 | 18 | 450 | 34.5 | 40 | 25.5 / 23.5 | 64 / 60 | 480 | 50 |
| Week 3 | 18 | 520 | 39.5 | 40 | 26.0 / 24.0 | 62 / 58 | 480 | 50 |
| Generative | ||||||||
| Week 1 | 12 | 1160 | 92.5 | 40 | 27.0 / 25.0 | 59 / 55 | 480 | 75 |
| Week 2 | 12 | 1160 | 92.5 | 40 | 28.0 / 25.0 | 55 / 51 | 480 | 75 |
| Week 3 | 12 | 1160 | 92.5 | 40 | 28.0 / 25.0 | 52 / 50 | 480 | 85 |
| Week 4 | 12 | 1160 | 92.5 | 40 | 29.0 / 25.0 | 52 / 50 | 480 | 100 |
| Week 5 | 12 | 1160 | 92.5 | 40 | 30.0 / 26.0 | 50 / 50 | 480 | 100 |
| Week 6 | 12 | 1160 | 92.5 | 40 | 30.0 / 26.0 | 50 / 50 | 480 | 100 |
| Week 7 | 12 | 1160 | 92.5 | 40 | 30.0 / 26.0 | 50 / 50 | 480 | 100 |
| Week 8 | 12 | 1160 | 92.5 | 40 | 29.0 / 25.0 | 50 / 50 | 480 | 100 |
| Week 9 | 12 | 1160 | 92.5 | 40 | 28.0 / 23.0 | 50 / 50 | 480 | 100 |
| Week 10 | 12 | 1160 | 92.5 | 40 | 26.0 / 20.0 | 50 / 50 | 480 | 100 |
| Week 11 | 12 | 1160 | 92.5 | 40 | 25.0 / 19.0 | 50 / 50 | 480 | 100 |
2.2 Fertilisation and Irrigation Regime
As described in the previous section, the experiment was generally divided into two large groups that differed in the PPF value supplied at the table level. In contrast to the climate settings, which were identical in both groups over the entire cultivation cycle, a distinction in the fertiliser quantities used was made in the various developmental sections of the generative phase. At a medium cumulative PPF value at the table level, a reduced photosynthetic activity was expected and, with identical climate settings, a lower nutrient demand was therefore anticipated. Depending on the developmental stage in the generative phase, fertiliser application rates reduced by 10–15 % (VBX) or 15–29 % (SHINE) were administered at a medium cumulative PPF value at the table level (cf. Table 3). The fertiliser concentration corresponding to the developmental phase was administered with each watering.
| Phase | Fertiliser schedules at an EC of 0.3 mS cm-1 in the source water (g 10L-1) | ||||
|---|---|---|---|---|---|
| High table PPF value in the generative phase | Medium table PPF value in the generative phase | ||||
| VBX | SHINE | VBX | SHINE | ||
| Pre-vegetative | |||||
| Day 1-3 | 6.0 | 0.0 | 6.0 | 0.0 | |
| Vegetative | |||||
| Week 1 | 8.0 | 0.0 | 8.0 | 0.0 | |
| Week 2 | 10.5 | 0.0 | 10.5 | 0.0 | |
| Week 3 | 12.5 | 0.0 | 12.5 | 0.0 | |
| Generative | |||||
| Week 1 | 16.0 | 2.0 | 14.0 | 1.5 | |
| Week 2 | 18.0 | 2.5 | 16.0 | 2.0 | |
| Week 3 | 18.0 | 3.5 | 16.0 | 3.0 | |
| Week 4 | 18.0 | 3.5 | 16.0 | 3.0 | |
| Week 5 | 18.0 | 3.5 | 16.0 | 3.0 | |
| Week 6 | 16.0 | 3.5 | 14.0 | 3.0 | |
| Week 7 | 14.0 | 3.5 | 12.0 | 3.0 | |
| Week 8 | 0.0 | 2.5 | 0.0 | 2.0 | |
| Week 9 | 0.0 | 1.5 | 0.0 | 1.0 | |
| Week 10 | 0.0 | 0.0 | 0.0 | 0.0 | |
| Week 11 | 0.0 | 0.0 | 0.0 | 0.0 | |
With a storage interval of 5 min, the mean gravimetric water content per pot was recorded on all tables throughout the entire growth cycle. Consequently, the daily transpiration rate could be determined. Watering was dosed via NetBow™ drip arcs (Netafim Ltd., Tel Aviv, Israel), which were supplied via valves with a flow volume of 4 L h-1. In general, in the present study the entire daily required water amount was administered approximately 1.5 h after the photoperiod began. In the vegetative phase of the cultivation cycle, a lower threshold of 55 % of the substrate's field capacity was set for plant fertigation. From this point, the substrate was watered back up to the upper threshold of this developmental phase (72–75 % of field capacity) (cf. Figure 1). The upper and lower thresholds set were subsequently changed or defined to match the respective developmental stages.

To ensure demand-based fertigation, from week 1 of the generative phase — while observing upper and lower thresholds for the water content in the substrate — the equivalent of the current 24 h transpiration rate was administered daily (cf. Figure 1). At 85 % of field capacity, the highest defined upper threshold was reached at the end of the bulking phase of flower growth (generative phase, week 8). Accordingly, the regular daily fertigation in the present study took place throughout the entire cultivation cycle without runoff water (no drain). An exception was the flushing events carried out at 7-day intervals from the beginning of the generative phase. These were introduced to prevent salinisation of the substrate. In each case, taking into account the mean current water content per pot, the calculated necessary application quantities were administered in order to saturate the substrate to 100 %. In addition, an excess of 0.5 L was added in each case. In combination with the flow volume of the valves (4 L h-1), the mean gravimetric water content per pot was subsequently approximately 92 %.
2.3 Lighting Treatments (Experimental Factors) and Experimental Setup
In order to adequately assess the effects of under-canopy lighting (UCL) on the growth and development of Cannabis sativa L., 12 lighting treatments were tested in the present study (cf. Tables 4, 5 and 6). To be able to make a statement about the effectiveness of UCL at differing top-light intensities, the experiment was divided into two major groups that differed in their cumulative PPF value at the table level during the generative phase. For this purpose, PPF values of 3386 µmol s-1 (high value) and 2635 µmol s-1 (medium value) were applied, which on the respective control tables corresponded to a top-light intensity (PPFD) of 1160 or 903 µmol m-2 s-1. During the respective vegetative phase, no differentiation of the PPF values at the table level took place.
Within both major groups, the effects of changes in the light distribution at identical PPF values at the table level were tested in each case. Both the timing of establishment of the change in light distribution and the respective percentage share of the under-canopy fixtures in the cumulative PPF value at the table level were considered as experimental factors. Regarding the contribution of the under-canopy fixtures to the cumulative PPF value at the table level, values of 15 and 30 % were set. Both tested establishment timings (day 18 of the vegetative phase, i.e. "early", and day 13 of the generative phase, i.e. "late") were chosen such that the plants were still in leaf formation or leaf development. In commercial facilities, UCL is often established considerably later (in week 4 or 5 of the generative phase). Since leaf formation/leaf growth and flower formation are already complete at this point, the (shade) leaves and flowers in the middle and lower canopy region usually have to be illuminated with a red-heavy light spectrum via UCL in order to achieve a positive effect. At this point, the resulting (shade) leaves (also sugar leaves and flowers) in the middle and lower canopy region could — owing to their structure (high specific leaf area, thin) — not efficiently process the green-heavy light spectrum of the SANlight fixtures, or a stress response would be triggered. With correct use, or early adaptation of the leaf structure toward sun or high-light leaves (low specific leaf area, thick), it was expected that the SANlight spectrum would be superior, since sun leaves illuminated with a red-heavy spectrum cannot — depending on the radiation intensity — reach their maximum in terms of photosynthetic activity. In general, however, the maximum possible photosynthetic rate of sun or high-light leaves is increased by approximately 100 % compared with the maximum possible photosynthetic rate of shade or low-light leaves.
In order also to obtain an assessment of possible effects from an increase in the cumulative amount of light at the table level by means of UCL, two additional treatments were established that represent the increase in the amount of light by 30 % at the defined early or late establishment time (cf. Tables 4, 5 and 6).
The placement and orientation of the under-canopy fixtures were identical on the respective tables or within the respective UCL treatments. In each case, four STIXX 4-100 fixtures (SANlight GmbH, Schruns, Austria) were used in order to achieve sufficient scope regarding the possible PPF values per table (cf. Figure 2).

| Treatment (T) | Differentiation of relevant treatment parameters from day 18 of vegetative growth through early use of Under Canopy Lighting (UCL) | ||||||
|---|---|---|---|---|---|---|---|
| No. | Description | EVO top-light table PPF (µmol s-1) | EVO dimming level (%) | EVO top-light PPFD (µmol m-2 s-1) | STIXX UCL table PPF (µmol s-1) | STIXX dimming level (%) | PPF ratio Top:Bottom (%:%) |
| High cumulative table PPF (3386 or 3426 µmol s-1 [T11 & T12]) in the generative phase | |||||||
| 1 | Control | 1445.7 | 39.5 | 520 | - | 0.0 | 100 : 0 |
| 2 | Including 15% UCL-early | 1228.8 | 33.6 | 442 | 216.2 | 21.3 | 85 :15 |
| 3 | Including 30% UCL-early | 1012.0 | 27.7 | 364 | 433.7 | 42.6 | 70 : 30 |
| 4 | Including 15% UCL-late | 1445.7 | 39.5 | 520 | - | 0.0 | 100 : 0 |
| 5 | Including 30% UCL-late | 1445.7 | 39.5 | 520 | - | 0.0 | 100 : 0 |
| 11 | Additional 30% UCL-early | 1445.7 | 39.5 | 520 | 433.7 | 42.6 | 100 + 30 |
| 12 | Additional 30% UCL-late | 1445.7 | 39.5 | 520 | - | 0.0 | 100 + 0 |
| Medium cumulative table PPF (2635.2 µmol s-1) in the generative phase | |||||||
| 6 | Control | 1445.7 | 39.5 | 520 | - | 0.0 | 100 : 0 |
| 7 | Including 15% UCL-early | 1228.8 | 33.6 | 442 | 216.2 | 21.3 | 85 :15 |
| 8 | Including 30% UCL-early | 1012.0 | 27.7 | 364 | 433.7 | 42.6 | 70 : 30 |
| 9 | Including 15% UCL-late | 1445.7 | 39.5 | 520 | - | 0.0 | 100 : 0 |
| 10 | Including 30% UCL-late | 1445.7 | 39.5 | 520 | - | 0.0 | 100 : 0 |
| Treatment (T) | Differentiation of relevant treatment parameters from day 1 of generative growth through early use of Under Canopy Lighting (UCL) | ||||||
|---|---|---|---|---|---|---|---|
| No. | Description | EVO top-light table PPF (µmol s-1) | EVO dimming level (%) | EVO top-light PPFD (µmol m-2 s-1) | STIXX UCL table PPF (µmol s-1) | STIXX dimming level (%) | PPF ratio Top:Bottom (%:%) |
| High cumulative table PPF (3386 or 3426 µmol s-1 [T11 & T12]) in the generative phase | |||||||
| 1 | Control | 3386 | 92.5 | 1160 | - | 0.0 | 100 : 0 |
| 2 | Including 15% UCL-early | 2878 | 78.6 | 986 | 508 | 50 | 85 :15 |
| 3 | Including 30% UCL-early | 2370 | 64.7 | 812 | 1016 | 100 | 70 : 30 |
| 4 | Including 15% UCL-late | 3386 | 92.5 | 1160 | - | 0.0 | 100 : 0 |
| 5 | Including 30% UCL-late | 3386 | 92.5 | 1160 | - | 0.0 | 100 : 0 |
| 11 | Additional 30% UCL-early | 2635 | 72.0 | 903 | 790 | 77.8 | 100 + 30 |
| 12 | Additional 30% UCL-late | 2635 | 72.0 | 903 | - | 0.0 | 100 + 0 |
| Medium cumulative table PPF (2635 µmol s-1) in the generative phase | |||||||
| 6 | Control | 2635 | 72.0 | 903 | - | 0.0 | 100 : 0 |
| 7 | Including 15% UCL-early | 2240 | 61.2 | 767 | 395 | 38.9 | 85 :15 |
| 8 | Including 30% UCL-early | 1845 | 50.4 | 632 | 791 | 77.8 | 70 : 30 |
| 9 | Including 15% UCL-late | 2635 | 72.0 | 903 | - | 0.0 | 100 : 0 |
| 10 | Including 30% UCL-late | 2635 | 72.0 | 903 | - | 0.0 | 100 : 0 |
| Treatment (T) | Final differentiation of all treatments from day 13 of generative growth through the use of Under Canopy Lighting (UCL) | ||||||
|---|---|---|---|---|---|---|---|
| No. | Description | EVO top-light table PPF (µmol s-1) | EVO dimming level (%) | EVO top-light PPFD (µmol m-2 s-1) | STIXX UCL table PPF (µmol s-1) | STIXX dimming level (%) | PPF ratio Top:Bottom (%:%) |
| High cumulative table PPF (3386 or 3426 µmol s-1 [T11 & T12]) in the generative phase | |||||||
| 1 | Control | 3386 | 92.5 | 1160 | - | 0.0 | 100 : 0 |
| 2 | Including 15% UCL-early | 2878 | 78.6 | 986 | 508 | 50 | 85 :15 |
| 3 | Including 30% UCL-early | 2370 | 64.7 | 812 | 1016 | 100 | 70 : 30 |
| 4 | Including 15% UCL-late | 2878 | 78.6 | 986 | 508 | 50 | 85 :15 |
| 5 | Including 30% UCL-late | 2370 | 64.7 | 812 | 1016 | 100 | 70 : 30 |
| 11 | Additional 30% UCL-early | 2635 | 72.0 | 903 | 790 | 77.8 | 100 + 30 |
| 12 | Additional 30% UCL-late | 2635 | 72.0 | 903 | 790 | 77.8 | 100 + 30 |
| Medium cumulative table PPF (2635 µmol s-1) in the generative phase | |||||||
| 6 | Control | 2635 | 72.0 | 903 | - | 0.0 | 100 : 0 |
| 7 | Including 15% UCL-early | 2240 | 61.2 | 767 | 395 | 38.9 | 85 :15 |
| 8 | Including 30% UCL-early | 1845 | 50.4 | 632 | 791 | 77.8 | 70 : 30 |
| 9 | Including 15% UCL-late | 2240 | 61.2 | 767 | 395 | 38.9 | 85 :15 |
| 10 | Including 30% UCL-late | 1845 | 50.4 | 632 | 791 | 77.8 | 70 : 30 |
2.4 Harvest and Drying
After the cultivation cycle lasting a total of 99 days (3 days pre-vegetative developmental phase, 21 days vegetative developmental phase, 75 days generative developmental phase), the plants of all treatments were harvested. The plants were cut close to the ground and hung, together with their leaves, on metal bars that were attached to CC containers without shelves (Container Centralen A/S, Odense, Denmark). Air drying of 15 days then followed (cf. Table 7).
| Drying day | Drying kinetics | |
|---|---|---|
| Temperature (°C) | Relative humidity (%) | |
| 1-5 | 19 | 50 |
| 6-7 | 17 | 50 |
| 8-9 | 15 | 50 |
| 10-12 | 14 | 50 |
| 13-15 | 13 | 50 |
After air drying, the inflorescences were removed and fractionated by hand, and the sugar leaves were subsequently removed. A general division of the flowers into the upper and lower plant halves was made in each case. Within this grouping, a distinction was made between the terminal flowers of the main shoots (top bud), of the side shoots (branch top bud), and the ordinary side-shoot flowers (branch bud). For all fractions, the dry mass after air drying was recorded in each case.
In order to be able to determine the total harvest index of the plants as well as the bulk density of the flowers, treatment- or table-specific dry-matter samples of approximately 100 g each (a composite sample from all plants per table) were taken from all flower fractions as well as from the residual-plant fraction (stem + leaf), dried at 105 °C to constant weight and reweighed. The calculated percentage dry-matter fractions were subsequently also used when converting the flower yield to a residual moisture of 12 % in the dry mass.
3. Results — Direct Comparison
For a better overview, each metric is shown in three directly comparable charts side by side: medium PPF (900 PPFD), high PPF (1160 PPFD) and the additional amount of light provided by UCL. This shows at a glance how under-canopy lighting performs at different top-light intensities. Click a chart to enlarge it.
3.1 Transpiration — Daily Evapotranspiration
Mean daily water release (L per plant) over the cultivation cycle, comparing medium and high table PPF as well as the additional light via UCL.


3.2 Height Growth — Plant Height
Plant height (cm) over the days after the start of vegetative growth, directly comparing the two top-light intensities.


3.3 Flower Yield per Plant
Flower dry mass per plant (g, at 12 % residual moisture).


3.4 Area Yield — Yield per m²
Flower dry mass per area (g/m², at 12 % residual moisture) — the practically relevant yield per cultivation area.


3.5 Harvest Index
Share of the flowers in the total above-ground dry weight.


3.6 Bulk Density of the Lower Flowers
Bulk density of the side-shoot flowers (branch buds) of the lower plant half (g/L) — a quality measure for the lower canopy.


3.7 Share of Flower Fractions in Total Yield
Distribution of the yield across the individual flower fractions.


4. Discussion of Results
Discussion to follow.