")
Influence of
UV light on
cannabis
We are investigating whether additional UV light has an influence on yield, cannabinoids and terpenes.
Summary
In our in-house plant laboratory at SANlight HQ, we investigated the myth of the influence of UV light on the cannabis plant.
- What is the effect of additional illumination with light of 365nm wavelength on yield, cannabinoids and terpenes?
- What effect does the additional illumination with light of a wavelength of 420nm have on yield, cannabinoids and terpenes?
- Is the effect on the cannabinoid and terpene profile the same for both wavelengths, or do the plants behave differently?
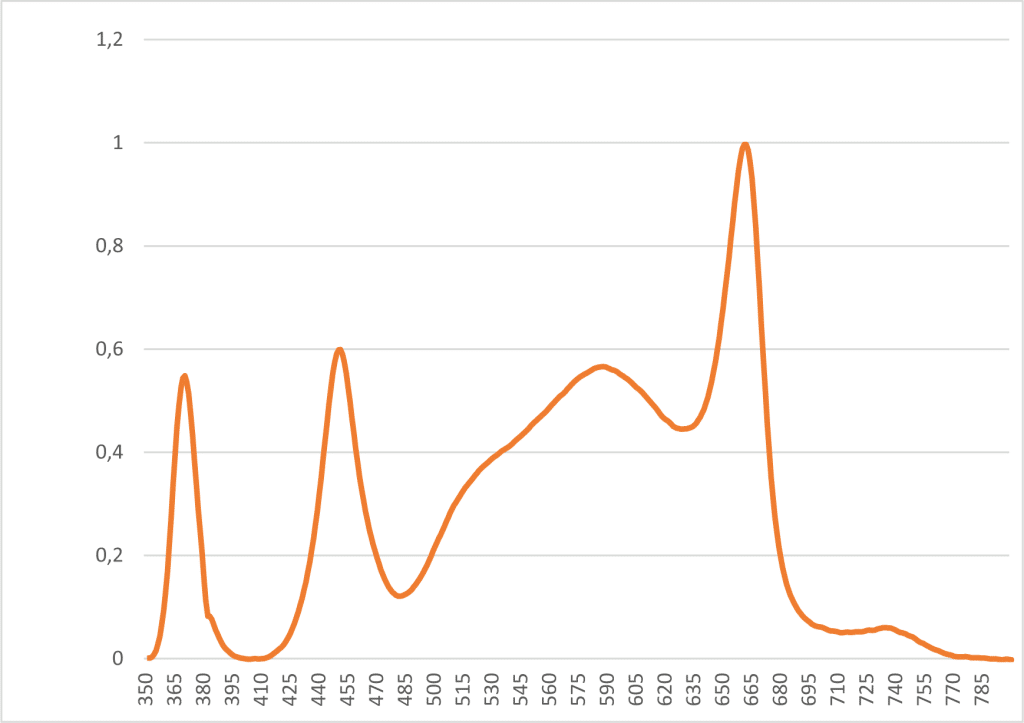
By definition, light with a wavelength of 420 nm no longer belongs to the UV range of the light spectrum. The term “UV light” is also often used without the UV-A, B and C classification. However, based on the absorption curve, this wavelength could cause similar reactions in plants as light with a wavelength of 365nm (UVA range). In general, these wavelengths were selected because efficient and long-lasting high-power LED chips are available on the market. Studies with wavelengths around 300nm are currently not carried out, as the available Led chips do not provide either acceptable efficiency or useful lifetimes. While LEDs with wavelengths > 350nm have an efficiency of > 50%, Led chips with a wavelength of 300nm operate with an efficiency of well below 10%.
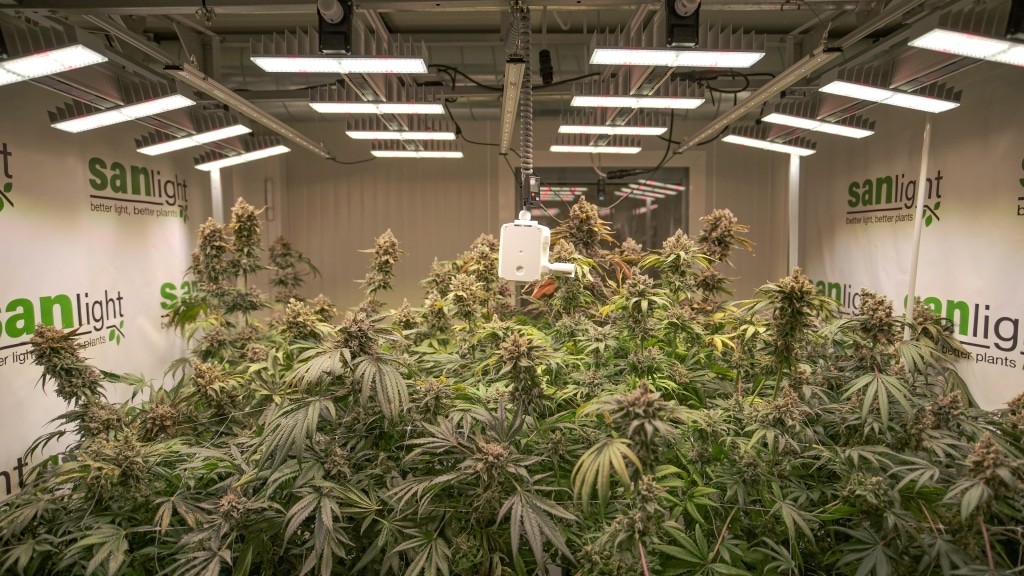
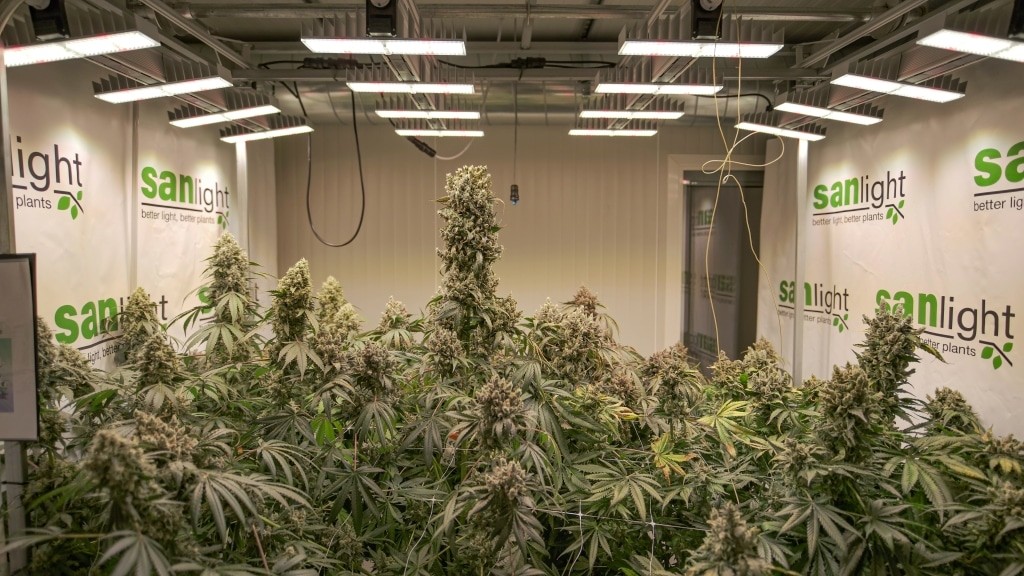
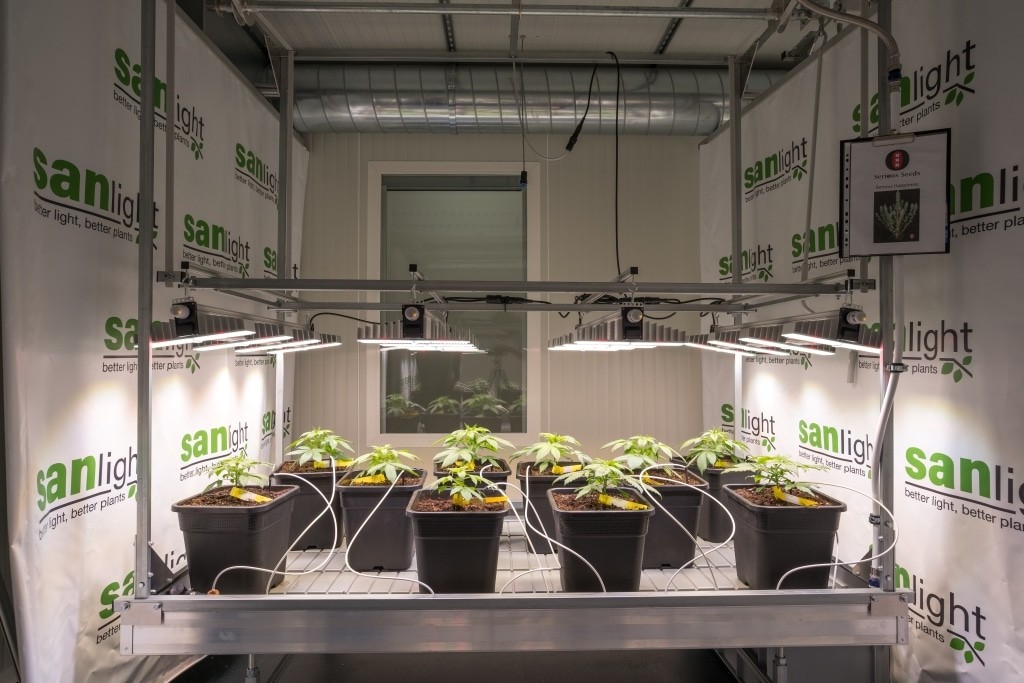
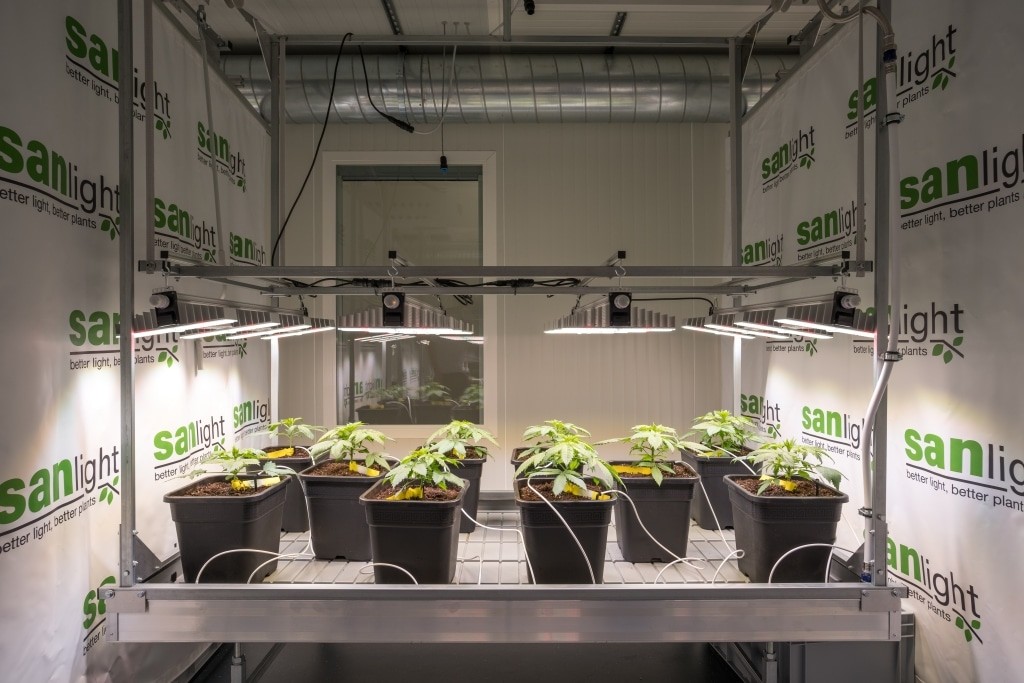
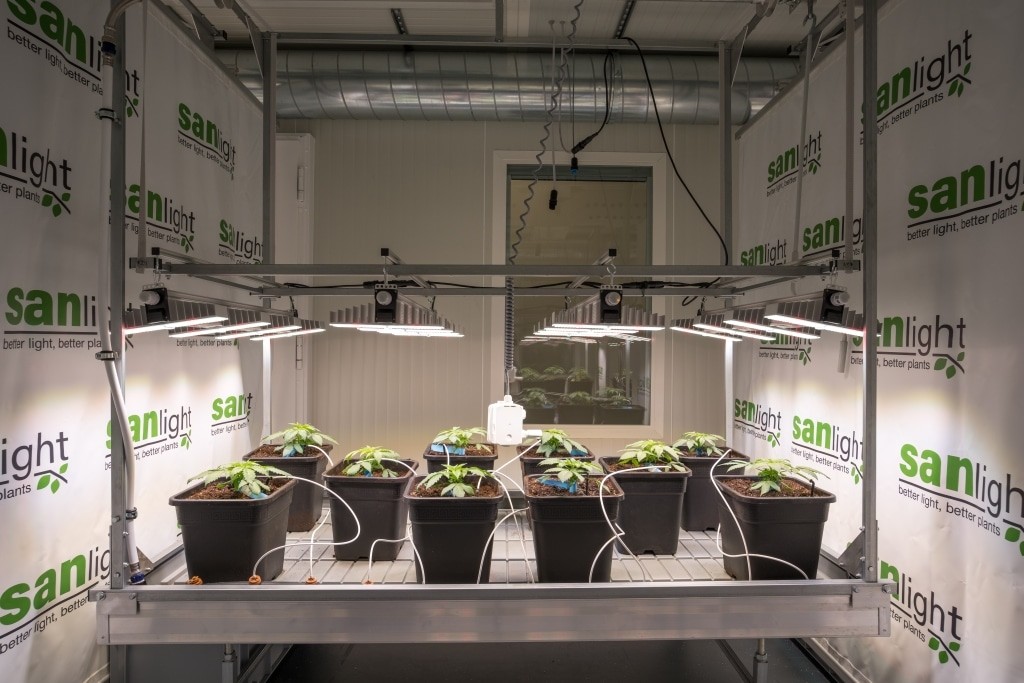
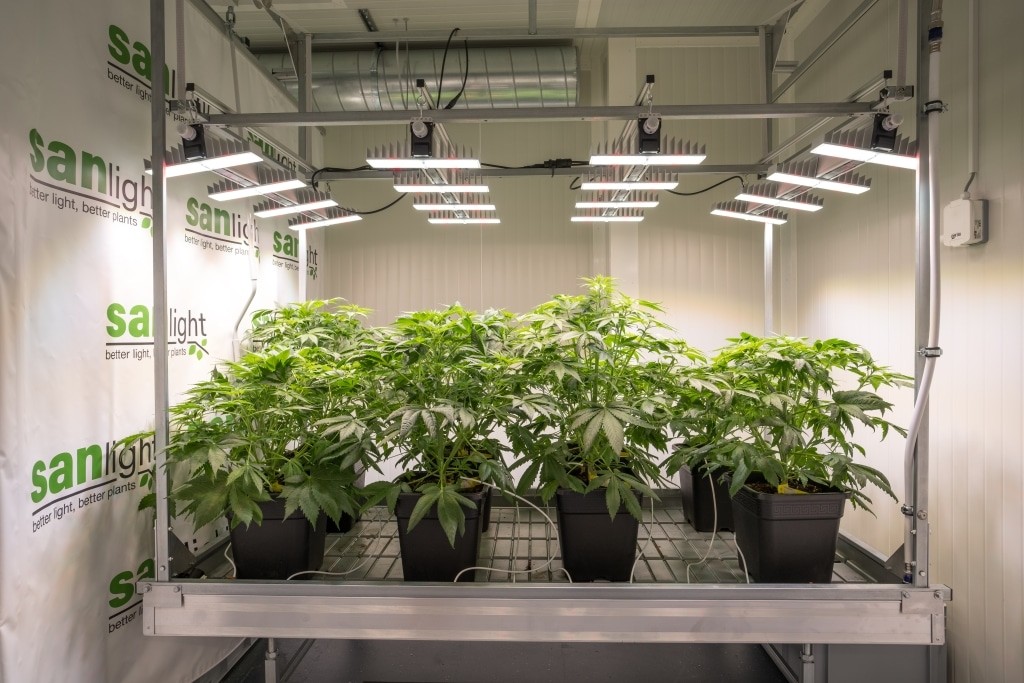
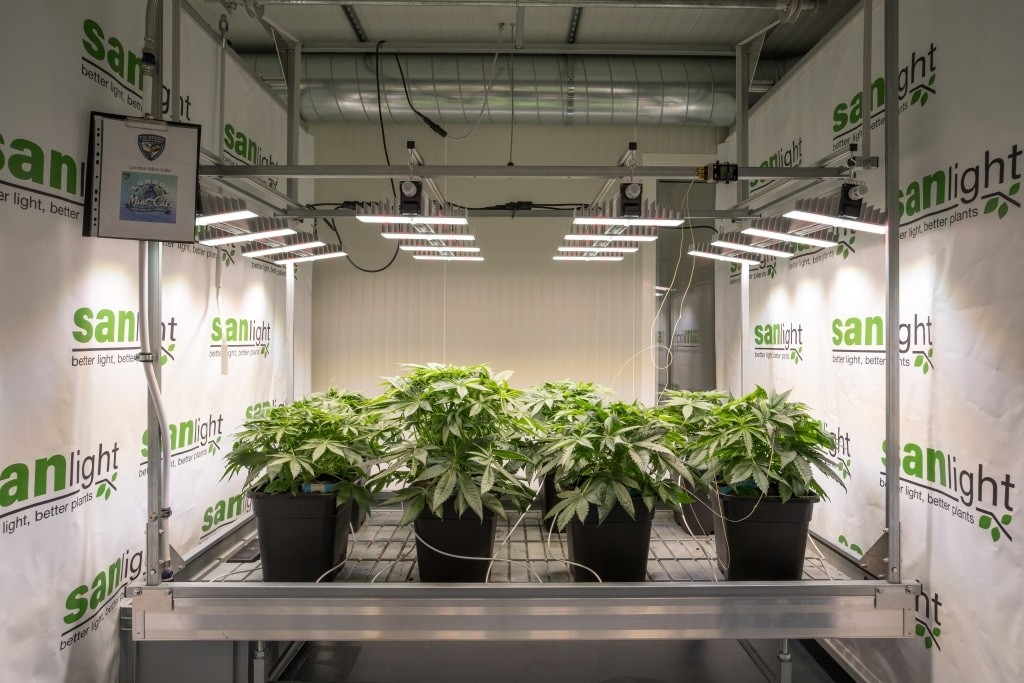
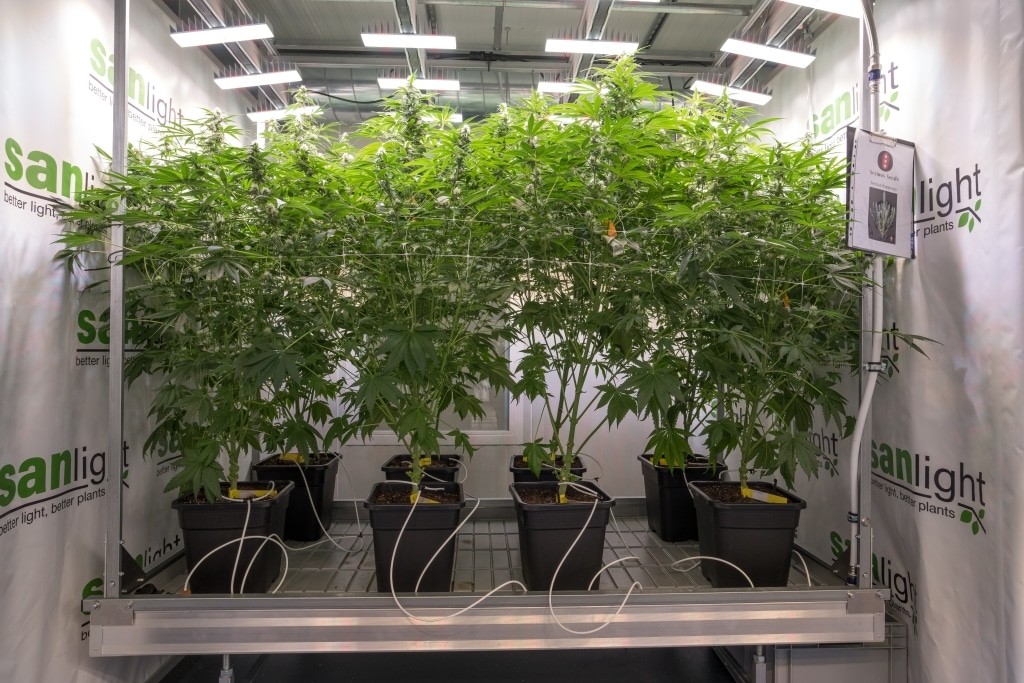
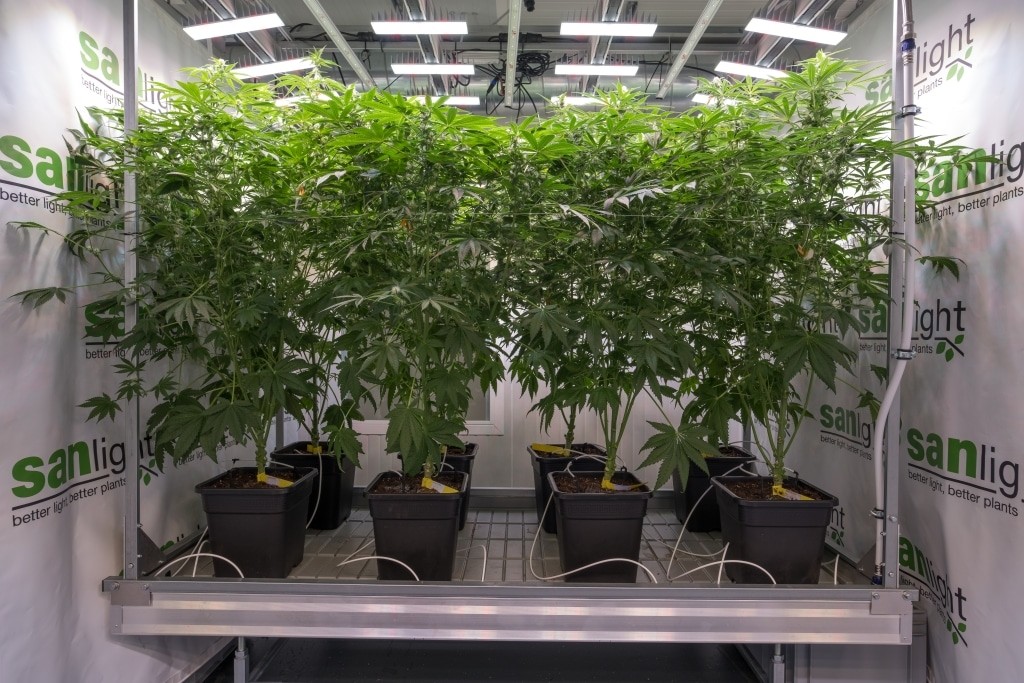
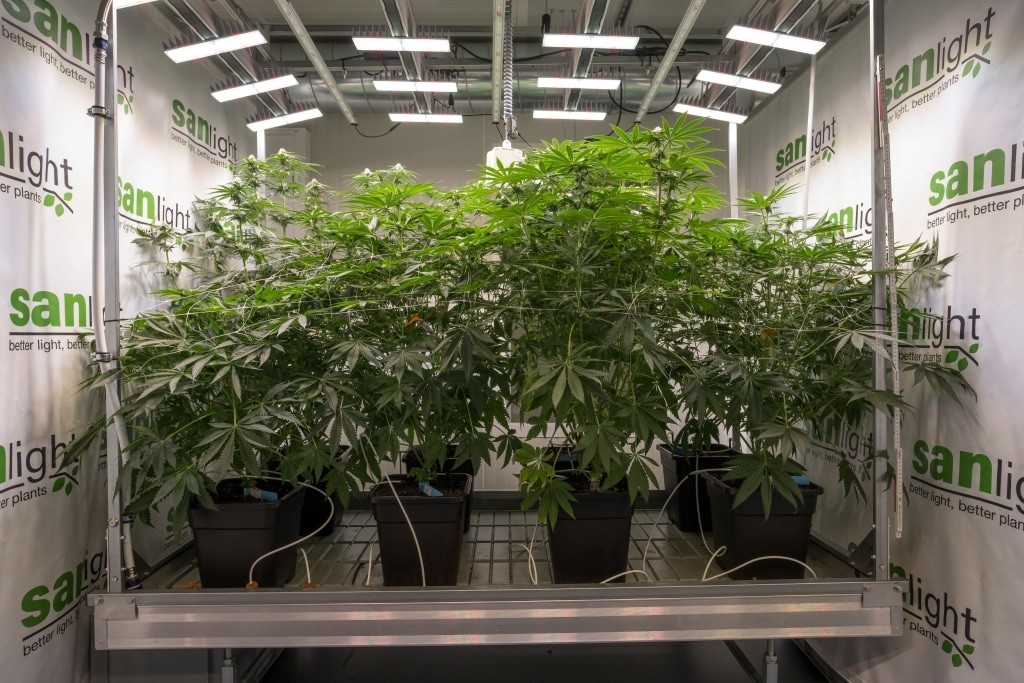
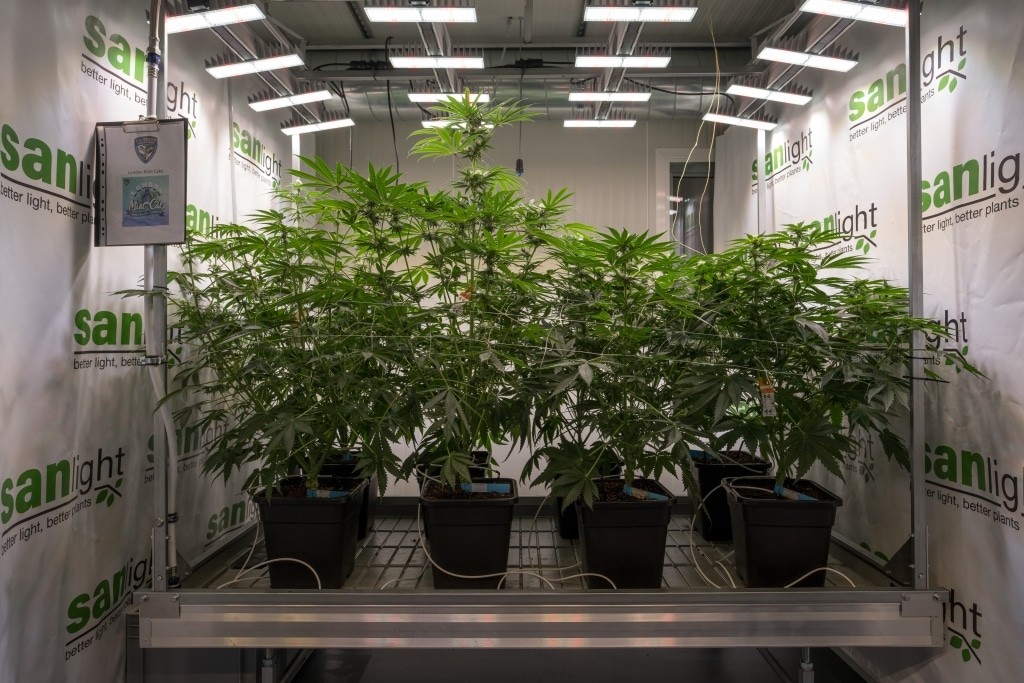
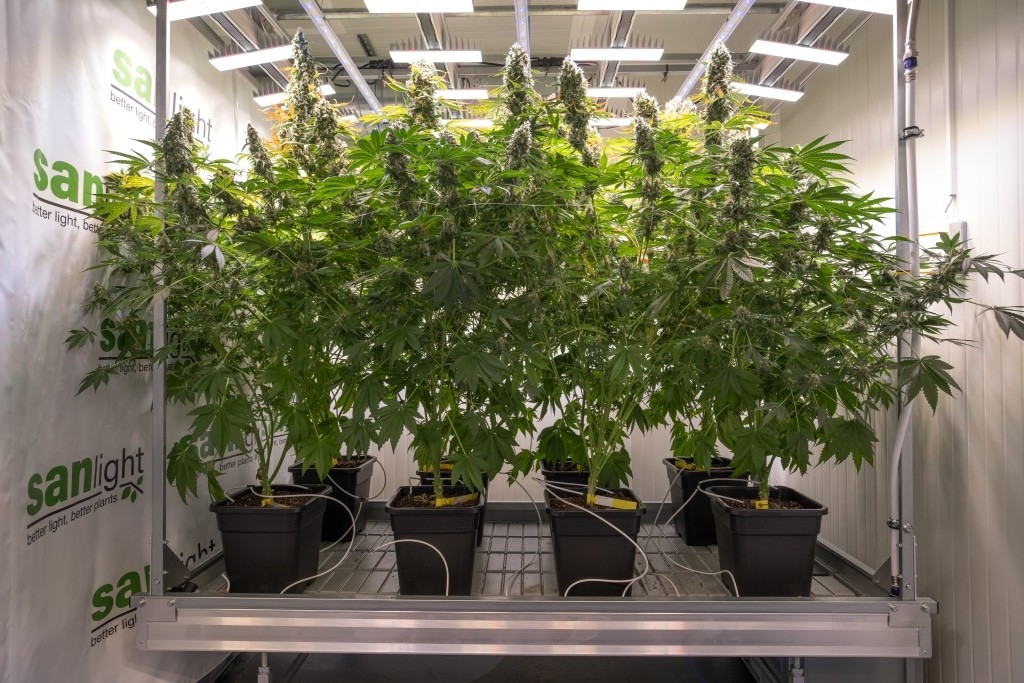
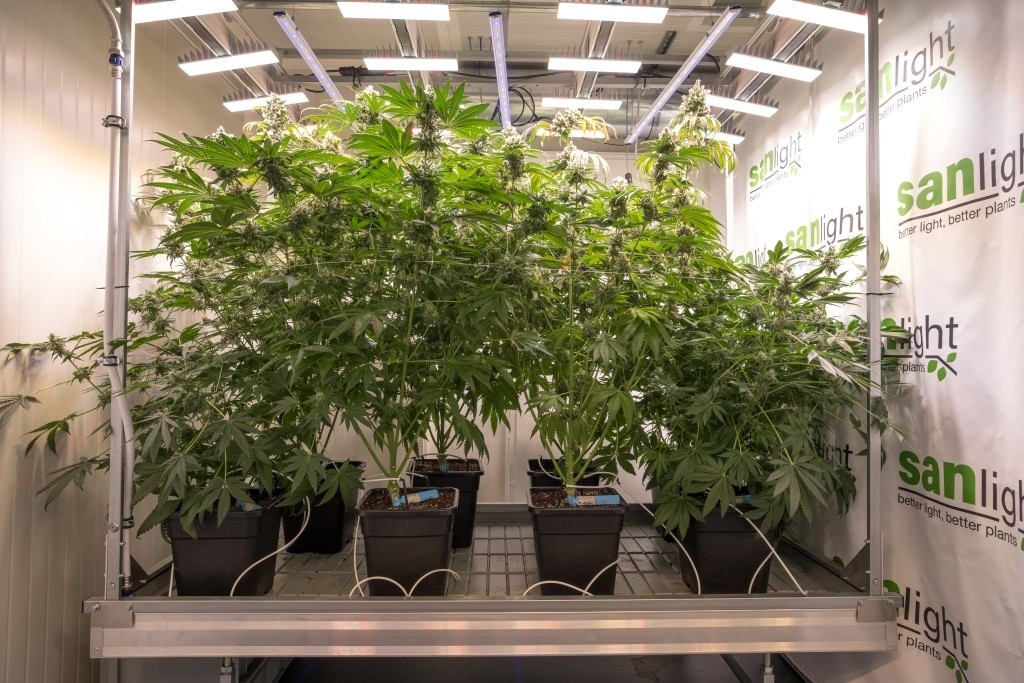
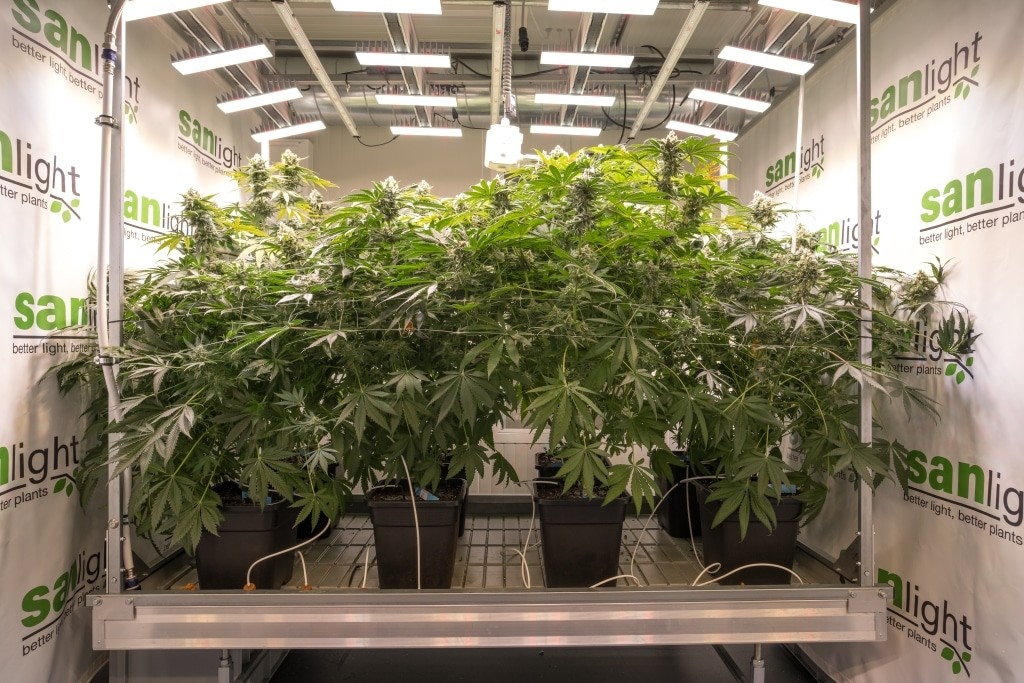
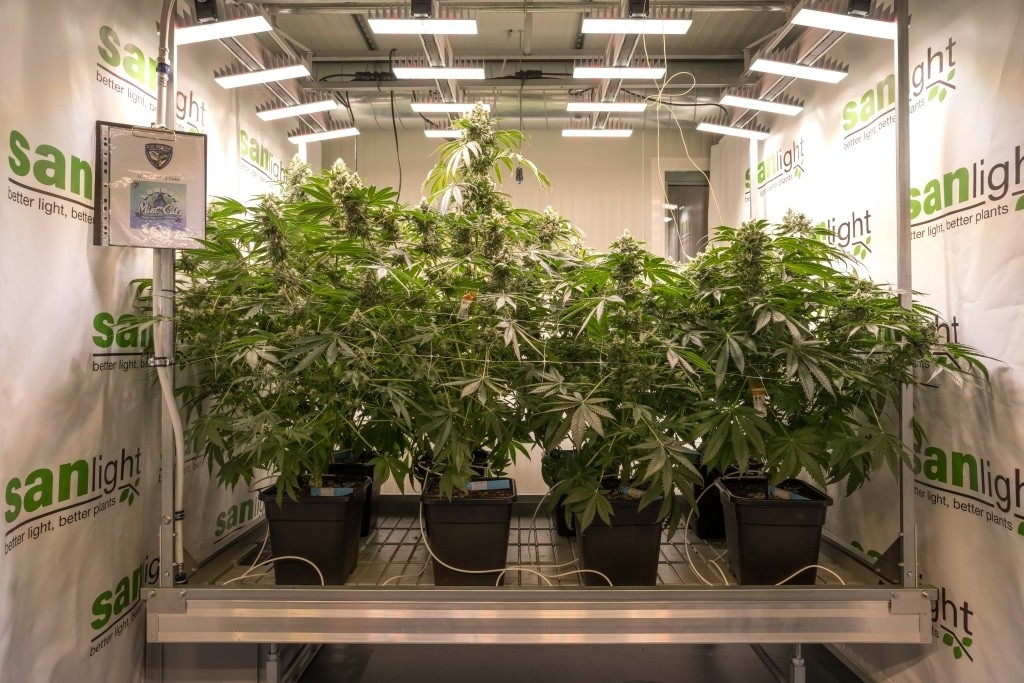
The question was investigated on two different genetics (Serious Happiness – Serious Seeds and London Mint Cake – T.H. Seeds) distributed over 6 plant tables of 2m x 1m each. 2 tables per genetics were exposed to the standard spectrum of our EVO series without UV light as a reference. In addition to the basic light spectrum, 2 tables were exposed to light with a wavelength of 420nm. The remaining 2 plant tables were supplied with light of wavelength 365nm in addition to the basic spectrum. All plants were supplied with the same nutrient solution and the same amount of water. You can find exact details in the list below.
In view of the fact that the tables with UV light received an approx. 9% higher light level, there is no clear statement that additional illumination with 420nm or 365n has a positive effect on yield, terpenes or cannabinoids. The terpene content was reduced with 365 nm light, while no significant effect was observed when treated with 420 nm light. With this light, the effects were in opposite directions, with an increase in THC in one genetics and a simultaneous decrease in the other genetics. In addition, the results also show that there is considerable genetic variation in THC levels within the plant genetics.
The energy-dependent efficiency (grams per watt) of the reference group is better than that of the groups with 365 nm and 420 nm additional light. This indicates that none of the plants were able to utilise the 365nm and 420nm wavelengths efficiently for the formation of flower mass. In the case of the London Mint Cake genetics, the additional light even led to a decrease in the total dry mass.
Note: This is an experiment from a multi-part series of tests. This report only represents an interim status of our investigations. This report should not be interpreted as a final statement on UV. Further internal tests are necessary in order to make a final statement on the effectiveness of UV light.
Table of contents
You can find a detailed description of the experiment further down in the blog or simply click on the desired section in the table of contents:
Serious Happiness - Serious Seeds
London Mint Cake - T.H. Seeds
Test setup
EVO 4-120 1.0
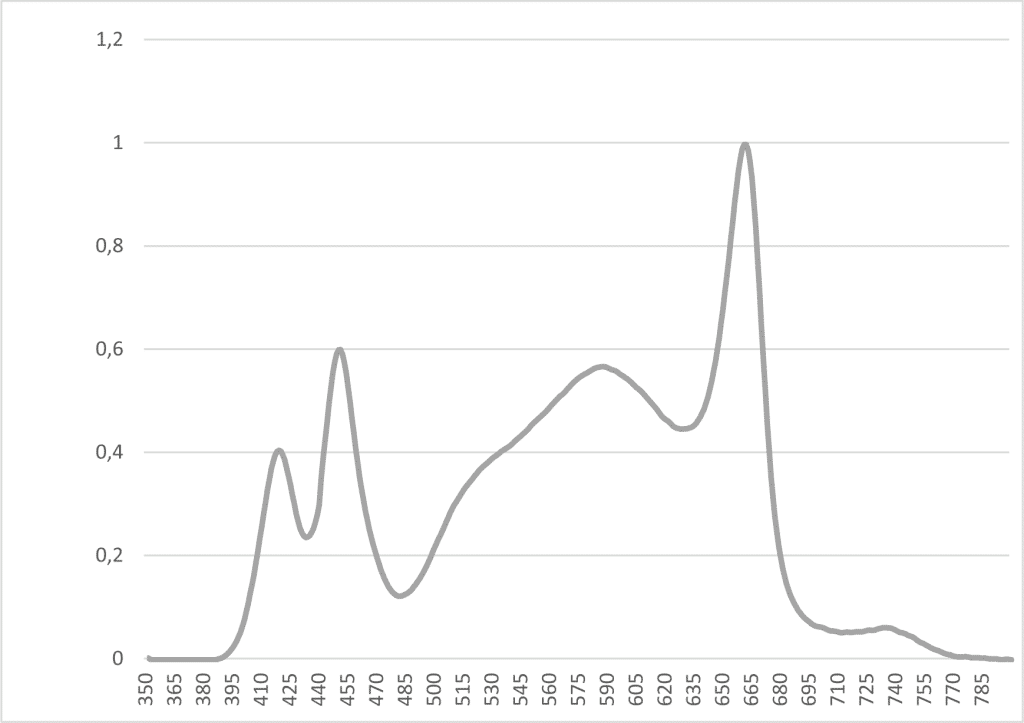
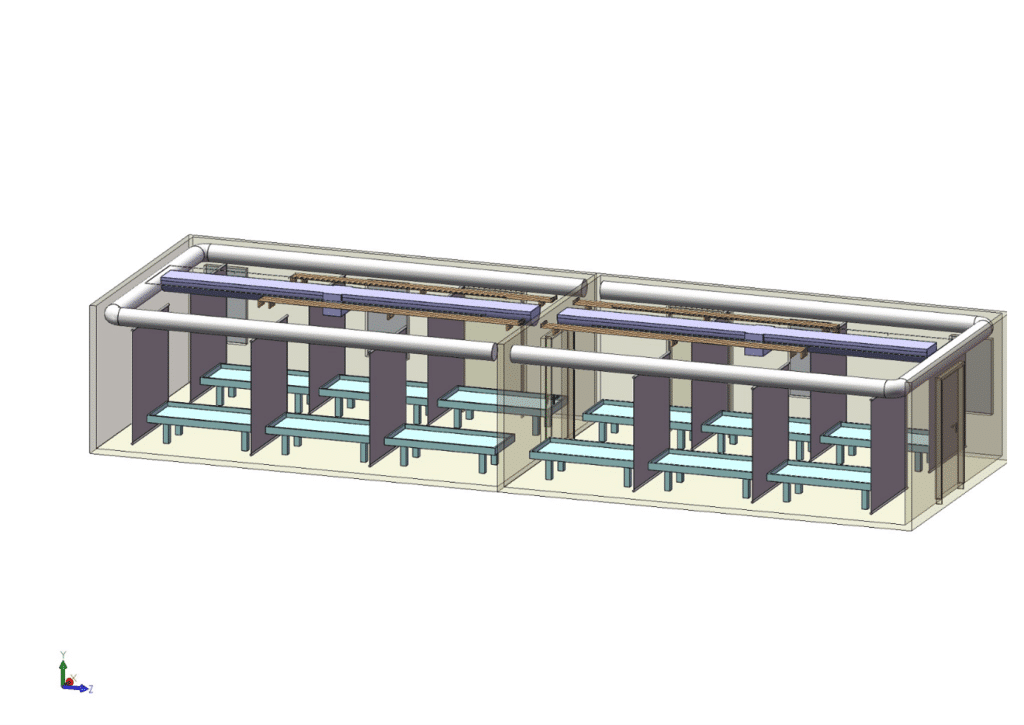
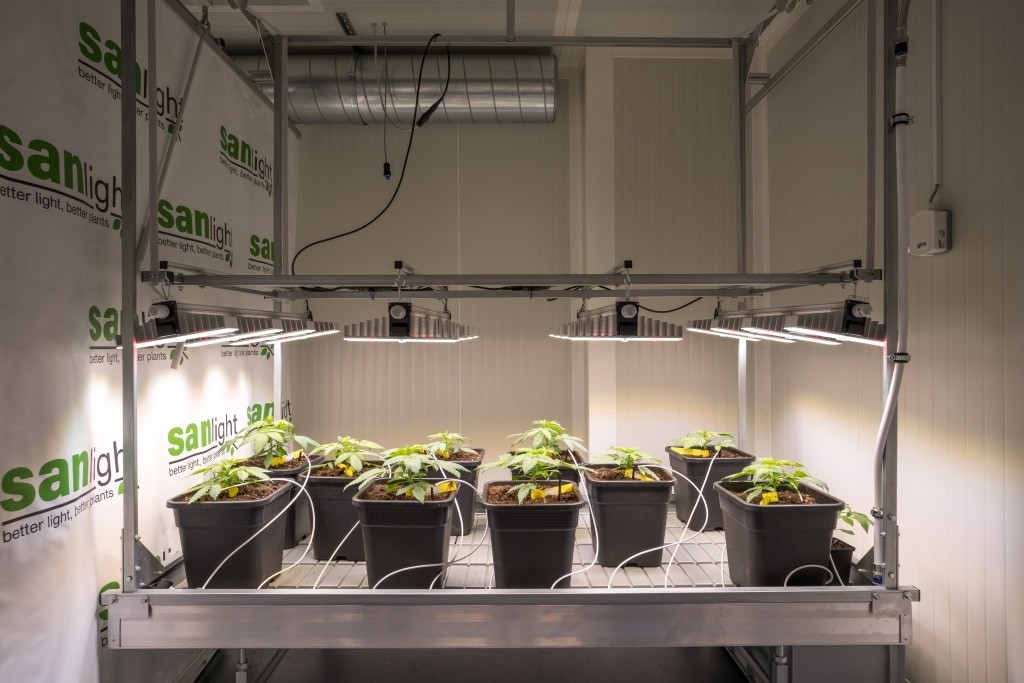
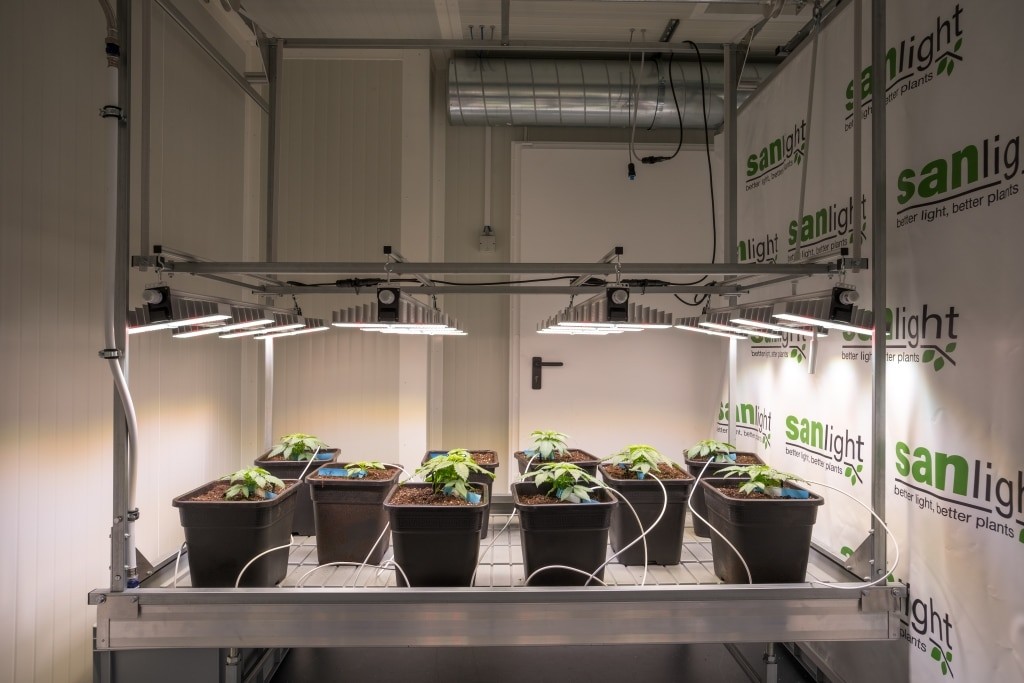
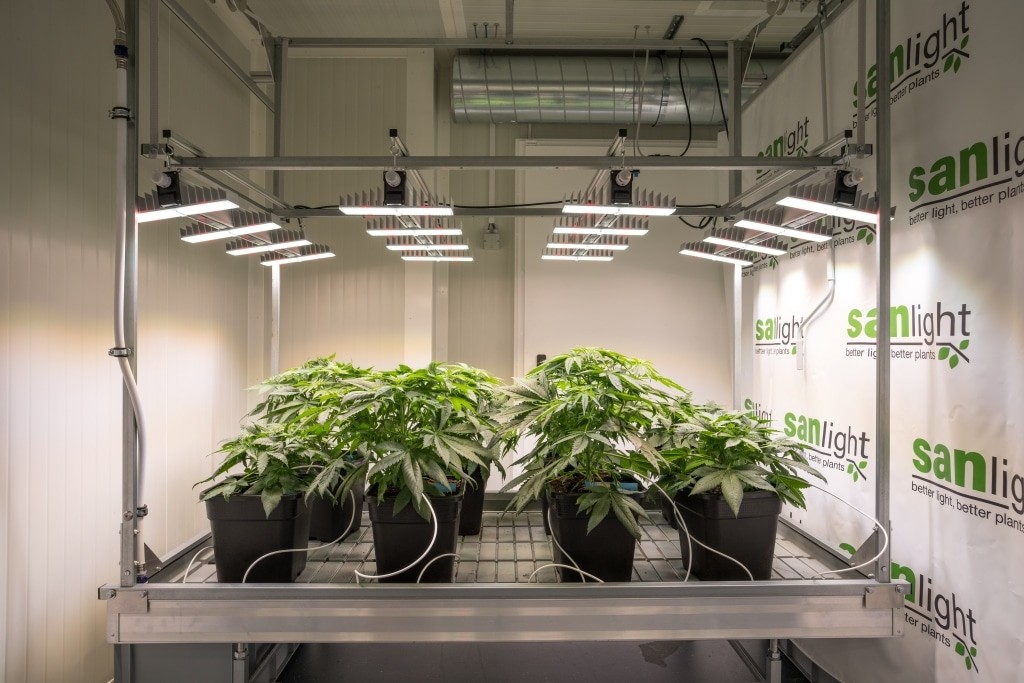
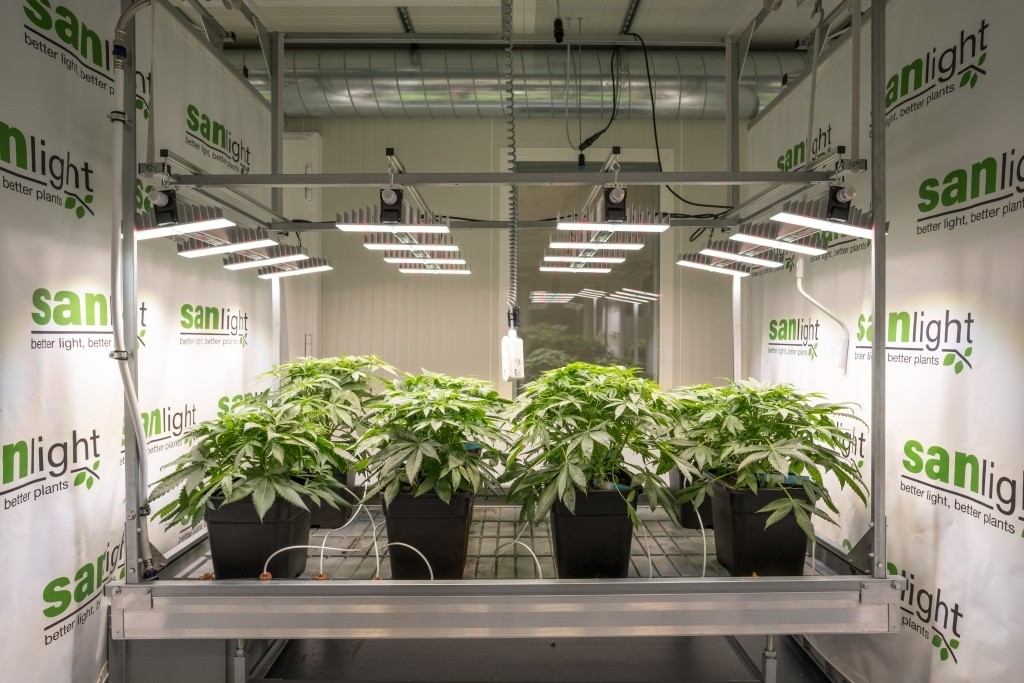
The cultivation tables from Knecht, measuring 2 m x 1 m, were illuminated with 4 EVO 4-120 1.0 units and are separated from each other by light curtains. For the test groups with 365nm and 420nm additional illumination, 3 special SANlight FLEX II luminaires with 30 W and the respective light spectrum were added in each case. The UV test plants were thus additionally illuminated with 45W per square metre and therefore with 80µmol/m2/s.
")
EVO 4-120 1.0 with FLEX II Special luminaire with 365nm or 420nm
Light spectrums
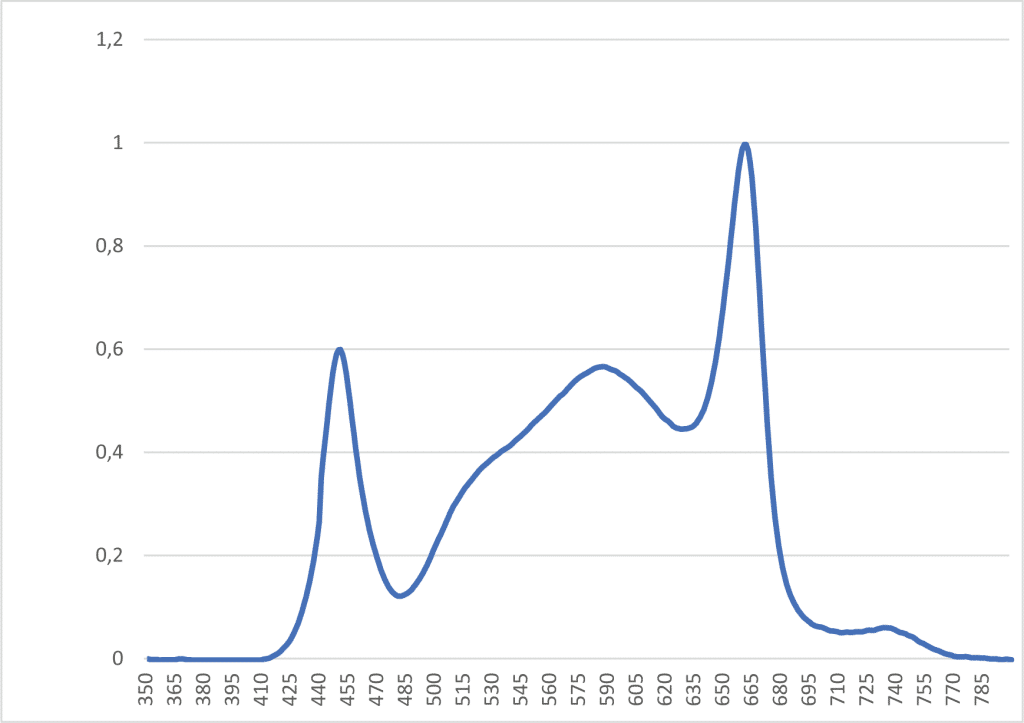
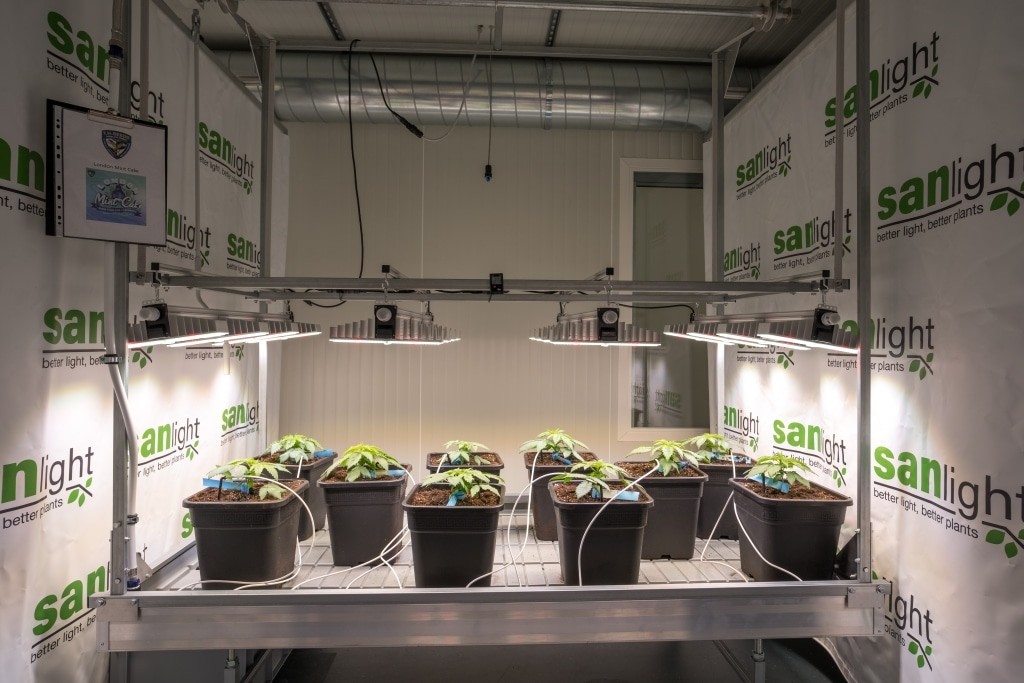
Two different genetics were used for the trial. After 5 days, 30 of the most vigorous plants were selected from 60 young plants for the trial. These were then potted in 15 litre pots with CANNA Terra Professional soil and added to the experiment. The tables were stocked with 10 plants per table and the 8 most vigorous plants per table were selected for the flowering phase before the changeover to the flowering phase.
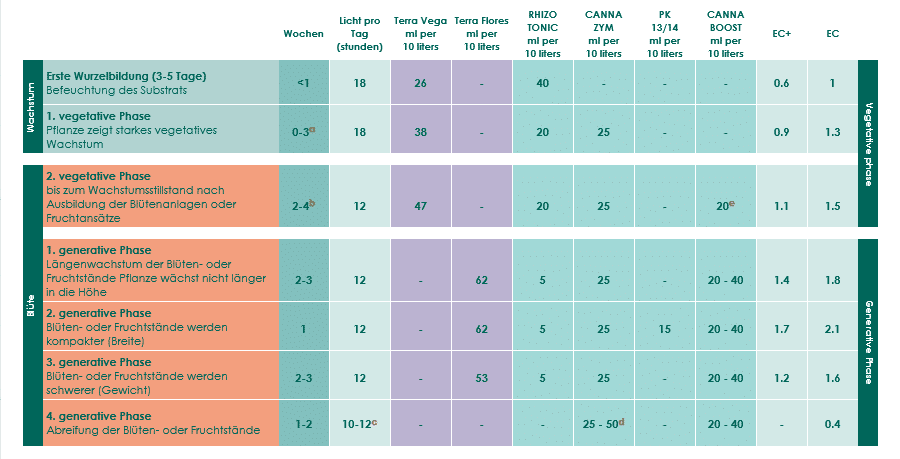
Nutrients were supplied via a central nutrient tank using pressure-compensated self-closing drippers. All plants were thus supplied with the same nutrient solution and the same watering quantity. In this trial, nutrients from the manufacturer CANNA were applied according to the fertiliser scheme below.
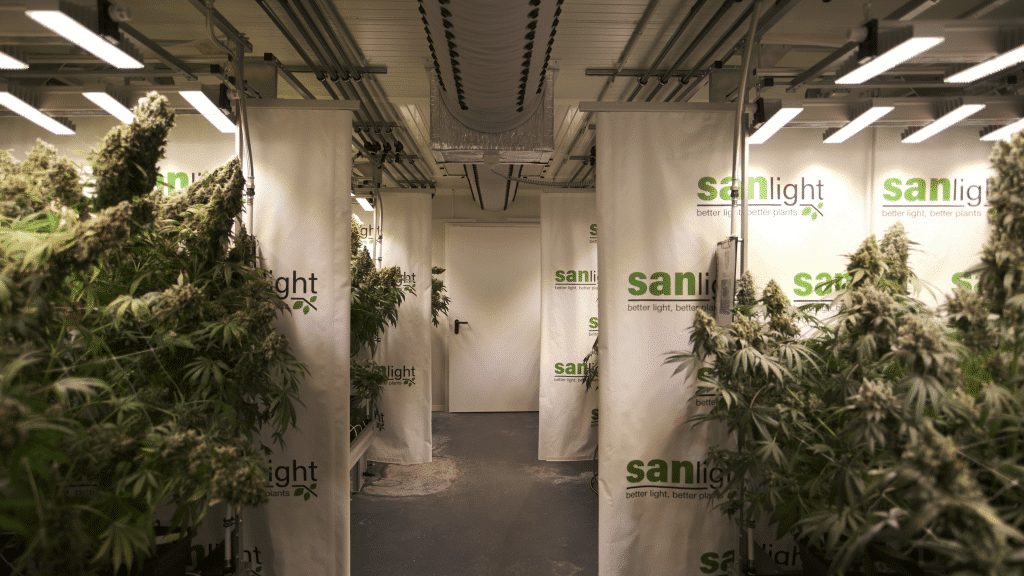
The trial was carried out in the laboratory for Controlled Enviroment Agriculture at SANlight GmbH.
Key data:
- Two laboratories of 40m² each with separate climate control
- CO2 gassing possible
- High-precision control of the following parameters:
- Temperature adjustable from 15°C to 35°C.
- Humidity adjustable from 25% to 90%.
Back to Table of contents
Methodology
Supplementary exposure
This is the second experiment in a multi-part series of experiments on the subject of additional UV illumination. In the previous experiment, up to 0.4 mol/d of supplemental light with a wavelength of 365nm or 420nm was administered. The changes in the cannabinoid and terpene profile in this first experiment were smaller than the experimental standard deviation. To provoke larger effects, the UV dose was increased to 3.5 mol/d in this experiment.
The table below shows the supplemental light intensities and the procedure used in this experiment.
|
Table |
Flowering day |
Base light |
Base light h/day |
DLI-Basis in mol/m²d |
Supplementary light |
Exposure in h /day Supplement |
UV h / day |
DLI UV in mol/m²d |
DLI total in mol/m²d |
|
1 |
20-70 |
SANlight EVO |
12 |
38,9 |
no supplement |
0 |
0 |
0 |
38,9 |
|
2 |
20-70 |
SANlight EVO |
12 |
38,9 |
+365nm |
12 |
12 |
3,5 |
42,3 |
|
3 |
20-70 |
SANlight EVO |
12 |
38,9 |
+420nm |
12 |
12 |
3,5 |
42,3 |
|
4 |
20-70 |
SANlight EVO |
12 |
38,9 |
+420nm |
12 |
12 |
3,5 |
42,3 |
|
5 |
20-70 |
SANlight EVO |
12 |
38,9 |
+365nm |
12 |
12 |
3,5 |
42,3 |
|
6 |
20-70 |
SANlight EVO |
12 |
38,9 |
no supplement |
0 |
0 |
0 |
38,9 |
Light, climate and nutrient values over the trial period
Light levels
| Test day & Light phase |
Table 1
4 x EVO 4-120 V1.0 no supplement |
Table 2
4 x EVO 4-120 V1.0 +90W 365nm from FD 20 |
Table 3
4 x EVO 4-120 V1.0 +90W 420nm from FD 20 |
Table 4
4 x EVO 4-120 V1.0 +90W 420nm from FD 20 |
Table 5
4 x EVO 4-120 V1.0 +90W 365nm from FD 20 |
Table 6
4 x EVO 4-120 V1.0 no supplement |
| Day 1-17
18h Vegetation phase Spectrum Daily Light Integral |
ØPPFDe 400µmol/m²/s
Power 420W Dimmer @42% EVO 1.0 DLI 25,92mol/m²/d |
ØPPFDe 400µmol/m²/s
Power 420W Dimmer @42% EVO 1.0 DLI 25,92mol/m²/d |
ØPPFDe 400µmol/m²/s
Power 420W Dimmer @42% EVO 1.0 DLI 25,92mol/m²/d |
ØPPFDe 400µmol/m²/s
Power 420W Dimmer @42% EVO 1.0 DLI 25,92mol/m²/d |
ØPPFDe 400µmol/m²/s
Power 420W Dimmer @42% EVO 1.0 DLI 25,92mol/m²/d |
ØPPFDe 400µmol/m²/s
Power 420W Dimmer @42% EVO 1.0 DLI 25,92mol/m²/d |
Climate data
| Test day & Light phase | Temp (°C) – day | RH (%) – day | Temp (°C) – night | RH (%) – night | Co² (ppm) – day | Co² (ppm) – night | VPD (kPa) |
| Day 1-17
18h Vegetation day 1-17 |
25 | 70 | 23 | 68 | 600 | 400 | 0,6 |
Nutrient levels
| Test day | Day 1-17
18/6h Vegetation day 1-17 |
|||||||||
| Light cycle | ||||||||||
| Phase day | ||||||||||
| Date | Nutrient solution absorbed per plant | EC-value [1] | pH-value [1] | Temperature [°C] | CALMAG [ml/L] | Terra Vega [ml/L] | Terra Flores [ml/L] | Rhizotonic [ml/L] | Cannazym [ml/L] | PK 13/14 [ml/L] |
| 02.05.23 | 800 | 1 | 5,9 | 17 | 0,4 | 2,6 | 0 | 4 | 0 | 0 |
| 08.05.23 | 900 | 1,1 | 5,7 | 17 | 0,4 | 3,79 | 0 | 2 | 2,5 | 0 |
| 09.05.23 | 900 | 1 | 5,6 | 18 | 0,4 | 3,79 | 0 | 2 | 2,5 | 0 |
| 10.05.23 | 900 | 1,3 | 6,2 | 18 | 0,4 | 4,63 | 0 | 2 | 2,5 | 0 |
| 11.05.23 | 900 | 1,3 | 6,2 | 18 | 0,4 | 4,63 | 0 | 2 | 2,5 | 0 |
| 12.05.23 | 900 | 1,5 | 6 | 14 | 0,4 | 4,63 | 0 | 2 | 2,5 | 0 |
| 13.05.23 | 900 | 1,5 | 6 | 14 | 0,4 | 4,63 | 0 | 2 | 2,5 | 0 |
| 14.05.23 | 900 | 1,5 | 6 | 20 | 0,4 | 4,63 | 0 | 2 | 2,5 | 0 |
| 15.05.23 | 900 | 1,5 | 6 | 20 | 0,4 | 4,63 | 0 | 2 | 2,5 | 0 |
| 15.05.23 | 900 | 1,5 | 6 | 20 | 0,4 | 4,63 | 0 | 2 | 2,5 | 0 |
| 16.05.23 | 900 | 1,5 | 6 | 16 | 0,4 | 4,63 | 0 | 2 | 2,5 | 0 |
| 16.05.23 | 900 | 1,5 | 6 | 16 | 0,4 | 4,63 | 0 | 2 | 2,5 | 0 |
| 17.05.23 | 900 | 1,5 | 6 | 20 | 0,4 | 4,63 | 0 | 2 | 2,5 | 0 |
| 17.05.23 | 900 | 1,5 | 6 | 20 | 0,4 | 4,63 | 0 | 2 | 2,5 | 0 |
| 18.05.23 | 900 | 1,5 | 6 | 20 | 0,4 | 4,63 | 0 | 2 | 2,5 | 0 |
| 19.05.23 | 900 | 1,5 | 6 | 20 | 0,4 | 4,63 | 0 | 2 | 2,5 | 0 |
| 19.05.23 | 900 | 1,5 | 6 | 20 | 0,4 | 4,63 | 0 | 2 | 2,5 | 0 |
Light levels
| Test day & Light phase |
Table 1
4 x EVO 4-120 V1.0 no supplement |
Table 2
4 x EVO 4-120 V1.0 +90W 365nm from FD 20 |
Table 3
4 x EVO 4-120 V1.0 +90W 420nm from FD 20 |
Table 4
4 x EVO 4-120 V1.0 +90W 420nm from FD 20 |
Table 5
4 x EVO 4-120 V1.0 +90W 365nm from FD 20 |
Table 6
4 x EVO 4-120 V1.0 no supplement |
| Day 18-28
12h Flowering day 1-11 Spectrum Daily Light Integral |
ØPPFDe 500µmol/m²/s
Power 540W Dimmer @54% EVO 1.0 DLI 21,6mol/m²/d |
ØPPFDe 500µmol/m²/s
Power 540W Dimmer @54% EVO 1.0 DLI 21,6mol/m²/d |
ØPPFDe 500µmol/m²/s
Power 540W Dimmer @54% EVO 1.0 DLI 21,6mol/m²/d |
ØPPFDe 500µmol/m²/s
Power 540W Dimmer @54% EVO 1.0 DLI 21,6mol/m²/d |
ØPPFDe 500µmol/m²/s
Power 540W Dimmer @54% EVO 1.0 DLI 21,6mol/m²/d |
ØPPFDe 500µmol/m²/s
Power 540W Dimmer @54% EVO 1.0 DLI 21,6mol/m²/d |
| Day 29-37
12h Flowering day 12-19 Spectrum Daily Light Integral |
ØPPFDe 750µmol/m²/s
Power 740W Dimmer @74% EVO 1.0 DLI 32,4mol/m²/d |
ØPPFDe 750µmol/m²/s
Power 740W Dimmer @74% EVO 1.0 DLI 32,4mol/m²/d |
ØPPFDe 750µmol/m²/s
Power 740W Dimmer @74% EVO 1.0 DLI 32,4mol/m²/d |
ØPPFDe 750µmol/m²/s
Power 740W Dimmer @74% EVO 1.0 DLI 32,4mol/m²/d |
ØPPFDe 750µmol/m²/s
Power 740W Dimmer @74% EVO 1.0 DLI 32,4mol/m²/d |
ØPPFDe 750µmol/m²/s
Power 740W Dimmer @74% EVO 1.0 DLI 32,4mol/m²/d |
Climate data
| Test day & Light phase | Temp (°C) – day | RH (%) – day | Temp (°C) – night | RH (%) – night | Co² (ppm) – day | Co² (ppm) – night | VPD (kPa) |
| Day 18-37
12h Flowering day 1-19 |
26 | 58 | 24 | 56 | 600 | 400 | 1 |
Nutrient levels
| Test day | Day 18-37 | |||||||||
| Light cycle | 12/12h | |||||||||
| Phase day | Flowering day 1-19 | |||||||||
| Date | Nutrient solution absorbed per plant | EC-value [1] | pH-value [1] | Temperature [°C] | CALMAG [ml/L] | Terra Vega [ml/L] | Terra Flores [ml/L] | Rhizotonic [ml/L] | Cannazym [ml/L] | PK 13/14 [ml/L] |
| 19.05.23 | 900 | 1,5 | 6 | 20 | 0,4 | 4,63 | 0 | 2 | 2,5 | 0 |
| 20.05.23 | 900 | 1,5 | 6 | 20 | 0,4 | 4,63 | 0 | 2 | 2,5 | 0 |
| 21.05.23 | 900 | 1,5 | 6 | 20 | 0,4 | 4,63 | 0 | 2 | 2,5 | 0 |
| 22.05.23 | 900 | 1,5 | 6 | 20 | 0,4 | 4,63 | 0 | 2 | 2,5 | 0 |
| 23.05.23 | 900 | 1,5 | 6 | 20 | 0,4 | 4,63 | 0 | 2 | 2,5 | 0 |
| 24.05.23 | 900 | 1,5 | 6 | 20 | 0,4 | 4,63 | 0 | 2 | 2,5 | 0 |
| 25.05.23 | 900 | 1,5 | 6 | 20 | 0,4 | 4,63 | 0 | 2 | 2,5 | 0 |
| 26.05.23 | 900 | 1,5 | 6 | 20 | 0,4 | 4,63 | 0 | 2 | 2,5 | 0 |
| 27.05.23 | 900 | 1,5 | 6 | 20 | 0,4 | 4,63 | 0 | 2 | 2,5 | 0 |
| 28.05.23 | 900 | 1,5 | 6 | 20 | 0,4 | 4,63 | 0 | 2 | 2,5 | 0 |
| 29.05.23 | 900 | 1,5 | 6 | 20 | 0,4 | 4,63 | 0 | 2 | 2,5 | 0 |
| 30.05.23 | 900 | 1,5 | 6 | 20 | 0,4 | 4,63 | 0 | 2 | 2,5 | 0 |
| 31.05.23 | 900 | 1,5 | 6 | 20 | 0,4 | 4,63 | 0 | 2 | 2,5 | 0 |
| 01.06.23 | 1800 | 1,6 | 6 | 20 | 0,4 | 5,5 | 0 | 2 | 2,5 | 0 |
| 02.06.23 | 1800 | 1,6 | 6 | 20 | 0,4 | 5,5 | 0 | 2 | 2,5 | 0 |
| 03.06.23 | 1350 | 1,6 | 6 | 20 | 0,4 | 5,5 | 0 | 2 | 2,5 | 0 |
| 03.06.23 | 900 | 1,6 | 6 | 20 | 0,4 | 5,5 | 0 | 2 | 2,5 | 0 |
| 04.06.23 | 1350 | 1,6 | 6 | 20 | 0,4 | 5,5 | 0 | 2 | 2,5 | 0 |
| 04.06.23 | 900 | 1,6 | 6 | 20 | 0,4 | 5,5 | 0 | 2 | 2,5 | 0 |
| 05.06.23 | 1350 | 1,6 | 6 | 20 | 0,4 | 5,5 | 0 | 2 | 2,5 | 0 |
| 05.06.23 | 900 | 1,6 | 6 | 20 | 0,4 | 5,5 | 0 | 2 | 2,5 | 0 |
| 06.06.23 | 1350 | 1,6 | 6 | 20 | 0,4 | 5,5 | 0 | 2 | 2,5 | 0 |
| 06.06.23 | 900 | 1,6 | 6 | 20 | 0,4 | 5,5 | 0 | 2 | 2,5 | 0 |
Light levels
| Test day & Light phase |
Table 1
4 x EVO 4-120 V1.0 no supplement |
Table 2
4 x EVO 4-120 V1.0 +90W 365nm from FD 20 |
Table 3
4 x EVO 4-120 V1.0 +90W 420nm from FD 20 |
Table 4
4 x EVO 4-120 V1.0 +90W 420nm from FD 20 |
Table 5
4 x EVO 4-120 V1.0 +90W 365nm from FD 20 |
Table 6
4 x EVO 4-120 V1.0 no supplement |
| Day 38-47
12h Flowering day 20-29 Spectrum Daily Light Integral |
ØPPFDe 900µmol/m²/s
Power 940W Dimmer @ 94% EVO 1.0 DLI 38,9mol/m²/d |
ØPPFDe 980µmol/m²/s
Power 1030W Dimmer @ 94% EVO 1.0 + 365nm DLI 42,3mol/m²/d |
ØPPFDe 980µmol/m²/s
Power 1030W Dimmer @ 94% EVO 1.0 + 420nm DLI 42,3mol/m²/d |
ØPPFDe 900µmol/m²/s
Power 1030W Dimmer @ 94% EVO 1.0 + 420nm DLI 42,3mol/m²/d |
ØPPFDe 980µmol/m²/s
Power 1030W Dimmer @ 94% EVO 1.0 + 365nm DLI 42,3mol/m²/d |
ØPPFDe 980µmol/m²/s
Power 940W Dimmer @ 94% EVO 1.0 DLI 38,9mol/m²/d |
Climate data
| Test day & Light phase | Temp (°C) – day | RH (%) – day | Temp (°C) – night | RH (%) – night | Co² (ppm) – day | Co² (ppm) – night | VPD (kPa) |
| Day 38-47
12h Flowering day 20-29 |
28 | 52 | 26 | 50 | 600 | 400 | 1,4 |
Nutrient levels
| Test day | Day 38-47 | |||||||||
| Light cycle | 12/12h | |||||||||
| Phase day | Flowering day 20-29 | |||||||||
| Date | Nutrient solution absorbed per plant | EC-value [1] | pH-value [1] | Temperature [°C] | CALMAG [ml/L] | Terra Vega [ml/L] | Terra Flores [ml/L] | Rhizotonic [ml/L] | Cannazym [ml/L] | PK 13/14 [ml/L] |
| 07.06.23 | 2100 | 1,6 | 6 | 20 | 0,4 | 5,5 | 0 | 2 | 2,5 | 0 |
| 07.06.23 | 700 | 1,6 | 6 | 20 | 0,4 | 5,5 | 0 | 2 | 2,5 | 0 |
| 08.06.23 | 1800 | 1,9 | 6 | 20 | 0,4 | 0,0 | 7,1 | 0,5 | 2,5 | 0 |
| 08.06.23 | 900 | 1,9 | 6 | 20 | 0,4 | 0,0 | 7,1 | 0,5 | 2,5 | 0 |
| 09.06.23 | 1800 | 1,9 | 6 | 20 | 0,4 | 0,0 | 7,1 | 0,5 | 2,5 | 0 |
| 09.06.23 | 900 | 1,9 | 6 | 20 | 0,4 | 0,0 | 7,1 | 0,5 | 2,5 | 0 |
| 10.06.23 | 1800 | 1,9 | 6 | 20 | 0,4 | 0,0 | 7,1 | 0,5 | 2,5 | 0 |
| 10.06.23 | 900 | 1,9 | 6 | 20 | 0,4 | 0,0 | 7,1 | 0,5 | 2,5 | 0 |
| 11.06.23 | 1800 | 1,9 | 6 | 20 | 0,4 | 0,0 | 7,1 | 0,5 | 2,5 | 0 |
| 11.06.23 | 900 | 1,9 | 6 | 20 | 0,4 | 0,0 | 7,1 | 0,5 | 2,5 | 0 |
| 12.06.23 | 1750 | 1,9 | 6 | 20 | 0,4 | 0,0 | 7,1 | 0,5 | 2,5 | 0 |
| 12.06.23 | 700 | 1,9 | 6 | 20 | 0,4 | 0,0 | 7,1 | 0,5 | 2,5 | 0 |
| 13.06.23 | 1750 | 1,9 | 6 | 20 | 0,4 | 0,0 | 7,1 | 0,5 | 2,5 | 0 |
| 13.06.23 | 700 | 1,9 | 6 | 20 | 0,4 | 0,0 | 7,1 | 0,5 | 2,5 | 0 |
| 14.06.23 | 1750 | 1,9 | 6 | 20 | 0,4 | 0,0 | 7,1 | 0,5 | 2,5 | 0 |
| 14.06.23 | 700 | 1,9 | 6 | 20 | 0,4 | 0,0 | 7,1 | 0,5 | 2,5 | 0 |
| 15.06.23 | 1750 | 1,9 | 6 | 20 | 0,4 | 0,0 | 7,1 | 0,5 | 2,5 | 0 |
| 15.06.23 | 700 | 1,9 | 6 | 20 | 0,4 | 0,0 | 7,1 | 0,5 | 2,5 | 0 |
Light levels
| Test day &Light phase |
Table 1
4 x EVO 4-120 V1.0 no supplement |
Table 2
4 x EVO 4-120 V1.0 +90W 365nm ab BT 20 |
Table 3
4 x EVO 4-120 V1.0 +90W 420nm ab BT 20 |
Table 4
4 x EVO 4-120 V1.0 +90W 420nm ab BT 20 |
Table 5
4 x EVO 4-120 V1.0 +90W 365nm ab BT 20 |
Table 6
4 x EVO 4-120 V1.0 no supplement |
| Day 48-86
12h Flowering day 30-70 Spectrum Daily Light Integral |
ØPPFDe 900µmol/m²/s
Power 940W Dimmer @ 94% EVO 1.0 DLI 38,9mol/m²/d |
ØPPFDe 980µmol/m²/s
Power 1030W Dimmer @ 94% EVO 1.0 + 365nm DLI 42,3mol/m²/d |
ØPPFDe 980µmol/m²/s
Power 1030W Dimmer @ 94% EVO 1.0 + 420nm DLI 42,3mol/m²/d |
ØPPFDe 900µmol/m²/s
Power 1030W Dimmer @ 94% EVO 1.0 + 420nm DLI 42,3mol/m²/d |
ØPPFDe 980µmol/m²/s
Power 1030W Dimmer @ 94% EVO 1.0 + 365nm DLI 42,3mol/m²/d |
ØPPFDe 980µmol/m²/s
Power 940W Dimmer @ 94% EVO 1.0 DLI 38,9mol/m²/d |
Climate data
| Test day & Light phase | Temp (°C) – day | RH (%) – day | Temp (°C) – night | RH (%) – night | Co² (ppm) – day | Co² (ppm) – night | VPD (kPa) |
| Day 48-86
12h Flowering day 30-70 |
28 | 52 | 26 | 50 | 600 | 400 | 1,4 |
Nutrient levels
| Test day | Day 48-86 | |||||||||
| Light cycle | 12/12h | |||||||||
| Phase day | Flowering day 30-70 | |||||||||
| Date | Nutrient solution absorbed per plant | EC-value [1] | pH-value [1] | Temperature [°C] | CALMAG [ml/L] | Terra Vega [ml/L] | Terra Flores [ml/L] | Rhizotonic [ml/L] | Cannazym [ml/L] | PK 13/14 [ml/L] |
| 16.06.23 | 1750 | 1,9 | 6 | 20 | 0,4 | 0,0 | 7,1 | 0,5 | 2,5 | 0 |
| 16.06.23 | 700 | 1,9 | 6 | 20 | 0,4 | 0,0 | 7,1 | 0,5 | 2,5 | 0 |
| 17.06.23 | 1750 | 1,9 | 6 | 20 | 0,4 | 0,0 | 7,1 | 0,5 | 2,5 | 0 |
| 17.06.23 | 700 | 1,9 | 6 | 20 | 0,4 | 0,0 | 7,1 | 0,5 | 2,5 | 0 |
| 18.06.23 | 1750 | 1,9 | 6 | 20 | 0,4 | 0,0 | 7,1 | 0,5 | 2,5 | 0 |
| 18.06.23 | 700 | 1,9 | 6 | 20 | 0,4 | 0,0 | 7,1 | 0,5 | 2,5 | 0 |
| 19.06.23 | 1750 | 2,2 | 6 | 20 | 0,4 | 0 | 7,2 | 0,5 | 2,5 | 1,5 |
| 19.06.23 | 700 | 2,2 | 6 | 20 | 0,4 | 0 | 7,2 | 0,5 | 2,5 | 1,5 |
| 20.06.23 | 1750 | 2,2 | 6 | 20 | 0,4 | 0 | 7,2 | 0,5 | 2,5 | 1,5 |
| 20.06.23 | 700 | 2,2 | 6 | 20 | 0,4 | 0 | 7,2 | 0,5 | 2,5 | 1,5 |
| 21.06.23 | 1750 | 2,2 | 6 | 20 | 0,4 | 0 | 7,2 | 0,5 | 2,5 | 1,5 |
| 21.06.23 | 700 | 2,2 | 6 | 20 | 0,4 | 0 | 7,2 | 0,5 | 2,5 | 1,5 |
| 22.06.23 | 1750 | 2,2 | 6 | 20 | 0,4 | 0 | 7,2 | 0,5 | 2,5 | 1,5 |
| 22.06.23 | 700 | 2,2 | 6 | 20 | 0,4 | 0 | 7,2 | 0,5 | 2,5 | 1,5 |
| 23.06.23 | 1750 | 2,2 | 6 | 20 | 0,4 | 0 | 7,2 | 0,5 | 2,5 | 1,5 |
| 23.06.23 | 700 | 2,2 | 6 | 20 | 0,4 | 0 | 7,2 | 0,5 | 2,5 | 1,5 |
| 24.06.23 | 1750 | 2,2 | 6 | 20 | 0,4 | 0 | 7,2 | 0,5 | 2,5 | 1,5 |
| 24.06.23 | 700 | 2,2 | 6 | 20 | 0,4 | 0 | 7,2 | 0,5 | 2,5 | 1,5 |
| 25.06.23 | 1750 | 2,2 | 6 | 20 | 0,4 | 0 | 7,2 | 0,5 | 2,5 | 1,5 |
| 25.06.23 | 700 | 2,2 | 6 | 20 | 0,4 | 0 | 7,2 | 0,5 | 2,5 | 1,5 |
| 26.06.23 | 1750 | 2,5 | 6 | 20 | 0,8 | 0 | 7,2 | 0,5 | 2,5 | 1,5 |
| 26.06.23 | 700 | 2,5 | 6 | 20 | 0,8 | 0 | 7,2 | 0,5 | 2,5 | 1,5 |
| 27.06.23 | 1750 | 2,5 | 6 | 20 | 0,8 | 0 | 7,2 | 0,5 | 2,5 | 1,5 |
| 27.06.23 | 700 | 2,5 | 6 | 20 | 0,8 | 0 | 7,2 | 0,5 | 2,5 | 1,5 |
| 28.06.23 | 1750 | 2,5 | 6 | 20 | 0,8 | 0 | 7,2 | 0,5 | 2,5 | 1,5 |
| 28.06.23 | 700 | 2,5 | 6 | 20 | 0,8 | 0 | 7,2 | 0,5 | 2,5 | 1,5 |
| 29.06.23 | 1750 | 1,9 | 6 | 20 | 0,8 | 0 | 7,2 | 0,5 | 2,5 | 0 |
| 29.06.23 | 700 | 1,9 | 6 | 20 | 0,8 | 0 | 7,2 | 0,5 | 2,5 | 0 |
| 30.06.23 | 1750 | 1,9 | 6 | 20 | 0,8 | 0 | 7,2 | 0,5 | 2,5 | 0 |
| 30.06.23 | 700 | 1,9 | 6 | 20 | 0,8 | 0 | 7,2 | 0,5 | 2,5 | 0 |
| 01.07.23 | 1750 | 1,9 | 6 | 20 | 0,8 | 0 | 7,2 | 0,5 | 2,5 | 0 |
| 01.07.23 | 700 | 1,9 | 6 | 20 | 0,8 | 0 | 7,2 | 0,5 | 2,5 | 0 |
| 02.07.23 | 1750 | 1,9 | 6 | 20 | 0,8 | 0 | 7,2 | 0,5 | 2,5 | 0 |
| 02.07.23 | 700 | 1,9 | 6 | 20 | 0,8 | 0 | 7,2 | 0,5 | 2,5 | 0 |
| 03.07.23 | 1750 | 1,9 | 6 | 20 | 0,8 | 0 | 7,2 | 0,5 | 2,5 | 0 |
| 03.07.23 | 700 | 1,9 | 6 | 20 | 0,8 | 0 | 7,2 | 0,5 | 2,5 | 0 |
| 04.07.23 | 1750 | 1,9 | 6 | 20 | 0,8 | 0 | 7,2 | 0,5 | 2,5 | 0 |
| 04.07.23 | 700 | 1,9 | 6 | 20 | 0,8 | 0 | 7,2 | 0,5 | 2,5 | 0 |
| 05.07.23 | 1750 | 1,9 | 6 | 20 | 0,8 | 0 | 7,2 | 0,5 | 2,5 | 0 |
| 05.07.23 | 700 | 1,9 | 6 | 20 | 0,8 | 0 | 7,2 | 0,5 | 2,5 | 0 |
| 06.07.23 | 1750 | 1,9 | 6 | 20 | 0,8 | 0 | 7,2 | 0,5 | 2,5 | 0 |
| 06.07.23 | 700 | 1,9 | 6 | 20 | 0,8 | 0 | 7,2 | 0,5 | 2,5 | 0 |
| 07.07.23 | 1750 | 1,9 | 6 | 20 | 0,8 | 0 | 7,2 | 0,5 | 2,5 | 0 |
| 07.07.23 | 700 | 1,9 | 6 | 20 | 0,8 | 0 | 7,2 | 0,5 | 2,5 | 0 |
| 08.07.23 | 1750 | 1,9 | 6 | 20 | 0,8 | 0 | 7,2 | 0,5 | 2,5 | 0 |
| 08.07.23 | 700 | 1,9 | 6 | 20 | 0,8 | 0 | 7,2 | 0,5 | 2,5 | 0 |
| 09.07.23 | 1750 | 1,9 | 6 | 20 | 0,8 | 0 | 7,2 | 0,5 | 2,5 | 0 |
| 09.07.23 | 700 | 1,9 | 6 | 20 | 0,8 | 0 | 7,2 | 0,5 | 2,5 | 0 |
| 10.07.23 | 1750 | 1,9 | 6 | 20 | 0,8 | 0 | 7,2 | 0,5 | 2,5 | 0 |
| 10.07.23 | 700 | 1,9 | 6 | 20 | 0,8 | 0 | 7,2 | 0,5 | 2,5 | 0 |
| 11.07.23 | 1750 | 1,9 | 6 | 20 | 0,8 | 0 | 7,2 | 0,5 | 2,5 | 0 |
| 11.07.23 | 700 | 1,9 | 6 | 20 | 0,8 | 0 | 7,2 | 0,5 | 2,5 | 0 |
| 12.07.23 | 1750 | 1,9 | 6 | 20 | 0,8 | 0 | 7,2 | 0,5 | 2,5 | 0 |
| 12.07.23 | 700 | 1,9 | 6 | 20 | 0,8 | 0 | 7,2 | 0,5 | 2,5 | 0 |
| 13.07.23 | 1750 | 1,9 | 6 | 20 | 0,8 | 0 | 7,2 | 0,5 | 2,5 | 0 |
| 13.07.23 | 700 | 1,9 | 6 | 20 | 0,8 | 0 | 7,2 | 0,5 | 2,5 | 0 |
| 14.07.23 | 1750 | 1,9 | 6 | 20 | 0,8 | 0 | 7,2 | 0,5 | 2,5 | 0 |
| 14.07.23 | 700 | 1,9 | 6 | 20 | 0,8 | 0 | 7,2 | 0,5 | 2,5 | 0 |
| 15.07.23 | 1750 | 1,9 | 6 | 20 | 0,8 | 0 | 7,2 | 0,5 | 2,5 | 0 |
| 15.07.23 | 700 | 1,9 | 6 | 20 | 0,8 | 0 | 7,2 | 0,5 | 2,5 | 0 |
| 16.07.23 | 1750 | 1,9 | 6 | 20 | 0,8 | 0 | 7,2 | 0,5 | 2,5 | 0 |
| 16.07.23 | 700 | 1,9 | 6 | 20 | 0,8 | 0 | 7,2 | 0,5 | 2,5 | 0 |
| 17.07.23 | 1750 | 1,9 | 6 | 20 | 0,8 | 0 | 7,2 | 0,5 | 2,5 | 0 |
| 17.07.23 | 700 | 1,9 | 6 | 20 | 0,8 | 0 | 7,2 | 0,5 | 2,5 | 0 |
| 18.07.23 | 1750 | 1,9 | 6 | 20 | 0,8 | 0 | 7,2 | 0,5 | 2,5 | 0 |
| 18.07.23 | 700 | 1,9 | 6 | 20 | 0,8 | 0 | 7,2 | 0,5 | 2,5 | 0 |
| 19.07.23 | 1750 | 1,9 | 6 | 20 | 0,8 | 0 | 7,2 | 0,5 | 2,5 | 0 |
| 19.07.23 | 700 | 1,9 | 6 | 20 | 0,8 | 0 | 7,2 | 0,5 | 2,5 | 0 |
| 20.07.23 | 1750 | 1,9 | 6 | 20 | 0,8 | 0 | 7,2 | 0,5 | 2,5 | 0 |
| 20.07.23 | 700 | 1,9 | 6 | 20 | 0,8 | 0 | 7,2 | 0,5 | 2,5 | 0 |
| 21.07.23 | 1750 | 1,9 | 6 | 20 | 0,8 | 0 | 7,2 | 0,5 | 2,5 | 0 |
| 21.07.23 | 700 | 1,9 | 6 | 20 | 0,8 | 0 | 7,2 | 0,5 | 2,5 | 0 |
| 22.07.23 | 1750 | 1,9 | 6 | 20 | 0,8 | 0 | 7,2 | 0,5 | 2,5 | 0 |
| 22.07.23 | 700 | 1,9 | 6 | 20 | 0,8 | 0 | 7,2 | 0,5 | 2,5 | 0 |
| 23.07.23 | 1750 | 1,9 | 6 | 20 | 0,8 | 0 | 7,2 | 0,5 | 2,5 | 0 |
| 23.07.23 | 700 | 1,9 | 6 | 20 | 0,8 | 0 | 7,2 | 0,5 | 2,5 | 0 |
| 24.07.23 | 1750 | 1,9 | 6 | 20 | 0,8 | 0 | 7,2 | 0,5 | 2,5 | 0 |
| 24.07.23 | 700 | 0,4 | 6 | 20 | 0 | 0 | 0 | 0 | 3 | 0 |
| 25.07.23 | 1750 | 0,4 | 6 | 20 | 0 | 0 | 0 | 0 | 3 | 0 |
| 25.07.23 | 700 | 0,4 | 6 | 20 | 0 | 0 | 0 | 0 | 3 | 0 |
| 26.07.23 | 1750 | 0,4 | 6 | 20 | 0 | 0 | 0 | 0 | 3 | 0 |
| 26.07.23 | 700 | 0,4 | 6 | 20 | 0 | 0 | 0 | 0 | 3 | 0 |
| 27.07.23 | 1750 | 0,4 | 6 | 20 | 0 | 0 | 0 | 0 | 3 | 0 |
| 27.07.23 | 700 | 0,4 | 6 | 20 | 0 | 0 | 0 | 0 | 3 | 0 |
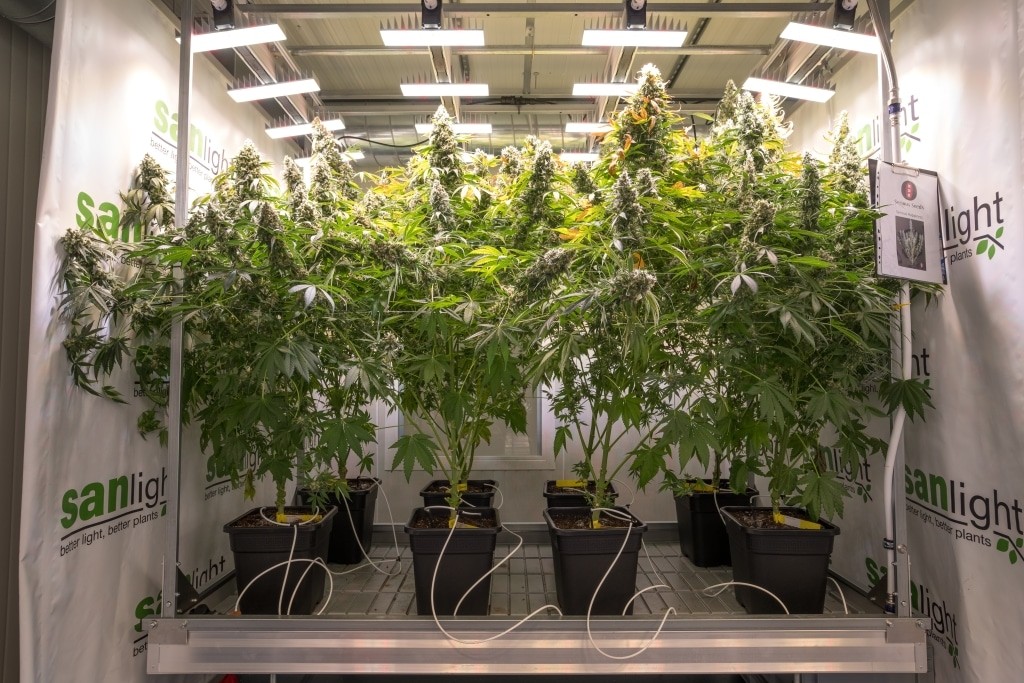
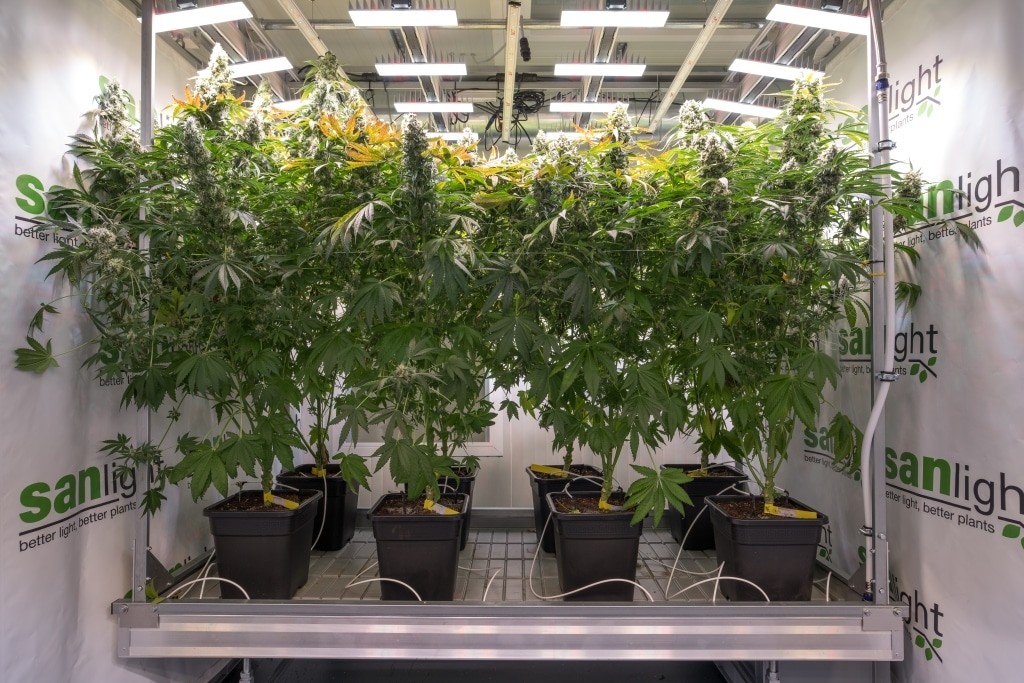
Harvesting and sampling
After 86 days (70 days of flowering), the plants were harvested. The plants were cut off and dried upside down at 18°C for a fortnight. The flowers were divided into 3 categories for sampling.
- A – flowers at the top and in the upper third of the main shoot and the strongest side shoots – flowers with the highest light influence (highest DLI values).
- B – fully developed, compact flowers with a flower/leaf ratio that matches the plant from the rest of the plant after removal of the A flowers – flowers with high to medium light influence (high to medium DLI values).
- C – weaker, less well-developed, less compact flowers with mostly poorer flower/leaf ratio from the lower and heavily shaded areas of the plant – flowers with low light influence due to shade cast above and next to them (low DLI values).
The flowers were analysed separately by category in an independent laboratory for their active ingredients and terpenes. The figure on the left shows the average total THC content of all samples sent in (A, B & C flowers) of the respective test group. The results shown below are mean values from all analysed quality categories.

Average THC and THCA by flower categories
Back to Table of contents
Results
The graph on the left shows the average total THC content of all samples submitted by the respective test group. Cannabidiol (CBD) and Cannabigerol (CBG) occur in the plants of the trial in rather small quantities in relation to Tetrahydrocannabinol (THC). The effects on CBD and CBG are therefore not analysed further in this article, as they are not the focus and have no relevance for the test results. The focus is on the results for the dominant cannabinoid THC, as well as the terpenes and the harvest weight.

The following table shows the difference in the total THC content of the plants treated with additional light in absolute values compared to the untreated reference group.
| Table | Supplementary exposure | Genetics | Ø T-THC absolute difference to reference group without additional light |
| 2 | + 365nm | Serious Happiness | +0,74% |
| 3 | + 420nm | Serious Happiness | +3,40% |
| 4 | + 420nm | London Mint Cake | -1,07% |
| 5 | + 365nm | London Mint Cake | +0,40% |
The total THC content within the plant genetics across all experimental groups shows no clear trend.
The graphic shows the average terpene content in mg/kg dry mass. The laboratory reports list 33 terpenes. In the course of the data analysis, no significant influences of the additional illumination with 365nm and/or 420nm on individual terpenes were noticed. A trend can be recognised for the average terpene content across all terpenes. Accordingly, light with a wavelength of 365nm had a degrading effect on the terpene content in this experiment. In both experimental groups treated with 365nm, a decrease in the average terpene content of the flowers was observed, despite the 8.89% higher light level (+80µmol). In the London Mint Cake group from T.H. Seeds +365nm the decrease in terpenes was -5.6%, in the Serious Happiness group from Serious Seeds +365nm it was -6.3%.
At 420nm, an increase in the sum of all terpenes of +1.29% to +2.7% was observed in relation to the untreated test group.

List of analysed terpenes
|
List of analysed terpenes |
|
|
alpha-Terpinen |
gamma-Terpineol |
|
Limonen |
Nerol |
|
trans-beta-Ocimen |
Pulegon |
|
Eucalyptol |
Geraniol |
|
cis-beta-Ocimen |
Geranylacetat |
|
gamma-Terpinen |
Farnesen |
|
Terpinolen |
alpha-Cedren |
|
Sabinenhydrat |
trans-Caryophyllen |
|
Linalool |
alpha-Humulen |
|
(+,-)-Fenchon |
Valencen |
|
(+)-endo-Fenchylalkohol |
cis-Nerolidol |
|
Isopulegol |
trans-Nerolidol |
|
(+,-)-Camphor |
(-)-Guaiol |
|
Isoborneol |
Caryophyllenoxid |
|
Menthol |
Cedrol |
|
(+,-)-Borneol |
(-)-alpha-Bisabolol |
|
alpha-Terpineol |
|
Yield of dry flowers in grams per square metre
The graph on the left shows the yield in dry flowers per square metre of each trial group. The yield in g/m² increased for the Serious Happiness plants exposed to additional light and, in contrast, decreased for the London Mint Cake plants exposed to additional light.

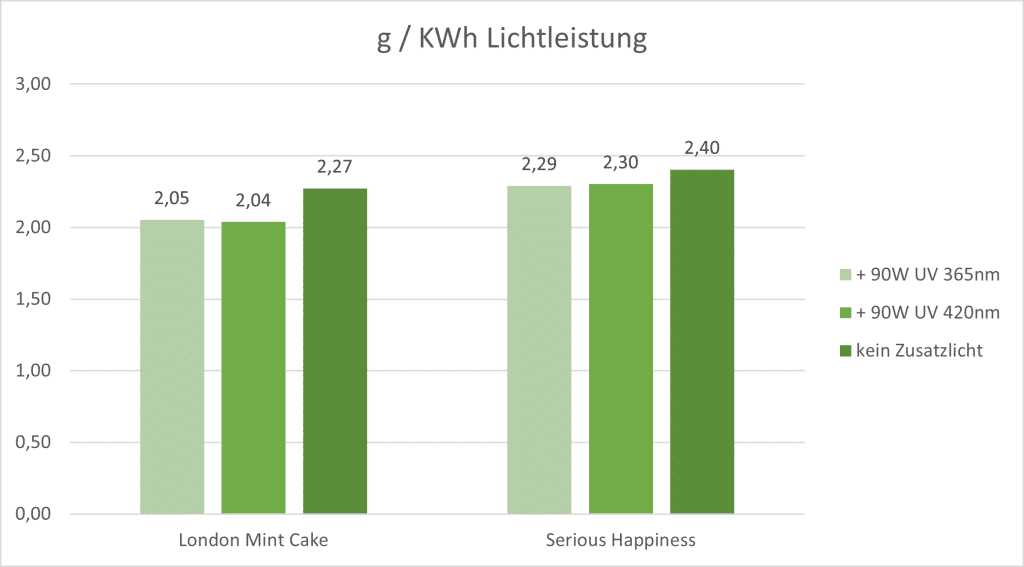
Yield of dry flowers in grams per watt or KWh
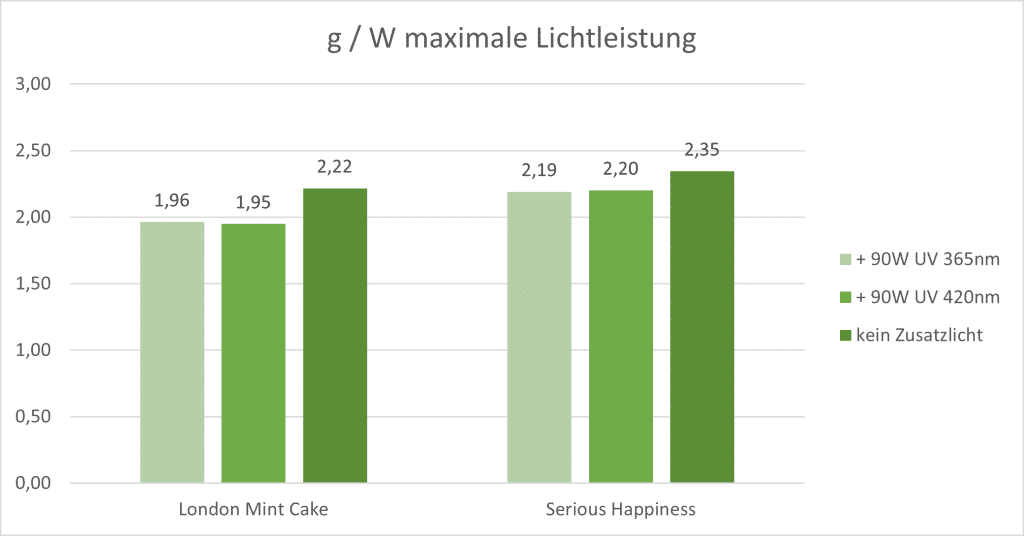
The first figure shows the yield in grams per watt of maximum light output used by each test group.
The energy-dependent efficiency of the untreated reference group is better than that of all treated trial groups. The differences within the 365nm and 420nm light groups are negligible.
This indicates that none of the plants were able to utilise the 365nm and 420nm wavelengths efficiently for the formation of flower mass. In the case of the London Mint Cake genetics, the additional light exposure even led to a decrease in the total dry mass.
Back to Table of contents
Summary Results
365nm UVA
- Exposing cannabis to additional light at 365nm shows no clear effect on yield.
- Exposing cannabis to additional 365nm light has an effect on the terpenes. The average content of terpenes is reduced by treatment with 365nm.
- Based on this study, exposing cannabis to additional light at 365 nm shows no clear effects on the THC content, but will be investigated further in a follow-up study, see final chapter.
420nm deep blue
- Exposing cannabis to additional light at 420nm has no clear effect on the yield. There were differences in plant mass in the trial, but these are due to the increased light level compared to the reference group.
- Exposing cannabis to additional light at 420nm showed no clear effects on the terpenes. In the experiment, there was an increase in the average terpene content in both cannabis varieties used of approx. 2%, but the reason for this is again most likely due to the 8,89% higher light level.
- Exposing cannabis to additional light at 420nm could have an effect on the formation of cannabinoids, especially THC. At the same time, the results also show that there is considerable genetic variation in THC levels within the plants. In some cases, the effects were in opposite directions, with an increase in THC in one genetics and a simultaneous decrease in another genetics. No definitive statement can therefore be made at present on the basis of this study.
365nm UVA and 420nm deep blue in comparison
- Based on the available results, the effects of the two wavelengths are different.
- Exposure to 365 nm has an effect on the plant mass and water content without increasing the flower weight; this effect could not be observed at 420 nm.
- The terpene content is reduced by 365nm, no significant effect was observed when treated with 420nm.
- There are indications that 420nm has an effect on the THC content in cannabis plants; no major effects were observed with 365nm.
Back to Table of contents
Outlook and follow-up
Note: This is an experiment from a multi-part series of tests. This report should not be interpreted as a final statement on UV.
The effects of exposing cannabis to 365nm UVA and 420nm deep blue will be investigated further. In this follow-up trial, all climatic conditions, nutrient supply, light exposure and other factors will be kept identical to this completed trial. The follow-up trial is carried out with cuttings from the 3 highest-yielding plants in each experimental group. Each experimental group of the follow-up trial is populated with clones of the nine highest-yielding plants per genetics of the preliminary trial. In the resulting layout (table layout) of each trial group, the positions of the individual plants on each trial group table will be identical. This will minimise variances in terms of light and microclimate.
We will be happy to share the results with you again in our blog!
Back to Table of contents


")
