")
Proof of Concept: SANlight EVO-Series Test
We have been working on the development of the new SANlight EVO for a long time. In the following article, we present the first field test with the EVO-series, which was carried out before the market launch.
Led technology is still developing at breakneck speed. New technologies are constantly coming onto the market. For us it is a concern to offer our customers the best solution with the latest technology. That is why our laboratories are constantly conducting empirical tests, for example, to develop the ideal light spectrum for various plants.
Once a product is developed, it also undergoes various testing procedures before it is released to the market. From these empirical tests with serial products we then derive recommendations for our customers, so that they can also achieve a perfect result in their cultivation.
In this article we present one of many tests with our new EVO-series.
For legal reasons, we must point out at this point that the cultivation of Cannabis Sativa L. is not legal in all countries. Please inform yourself about the legal situation in your country before imitating this experiment. The experiment shown here complies with the legal regulations in Austria, where this experiment was conducted.
Objective
The aim of the experiment was to find out at which light intensities the yield stops increasing under atmospheric CO2 and how these light intensities influence the bleaching of the flowers.
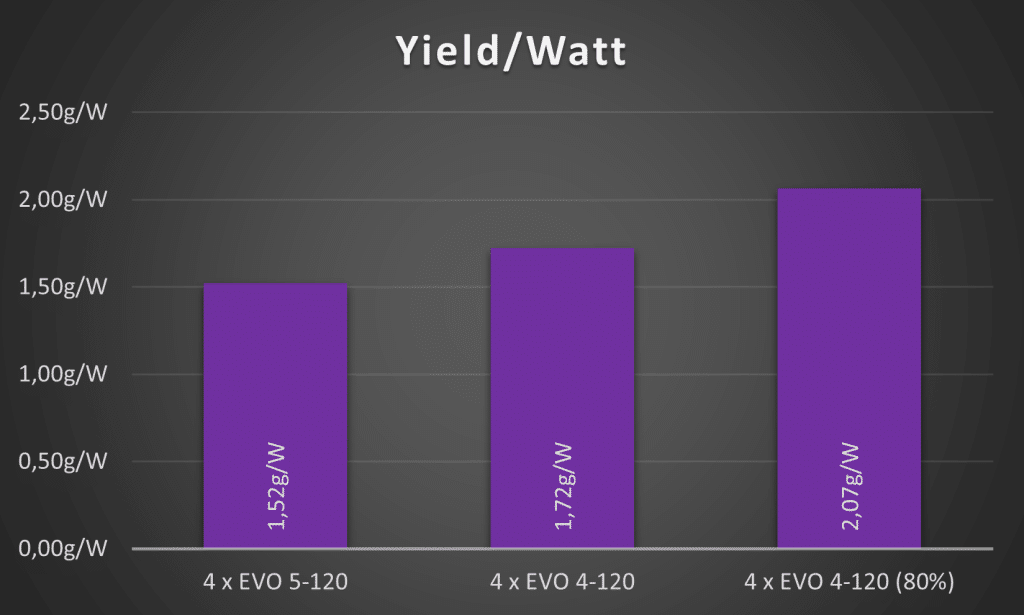
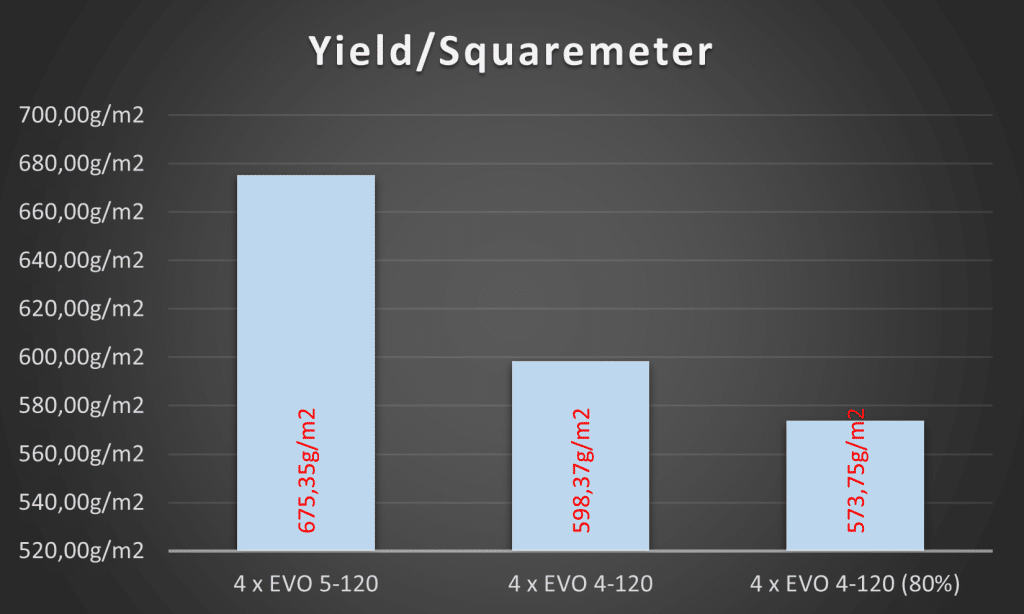
Yields were evaluated in two different ways. One is the grams per watt ratio. This means examining how much yield can be produced with one watt. The other is the yield to area ratio. It was investigated at which exposure intensity the best possible yield per square meter can be achieved.
Methodology
The entire experiment took place in a single room, in one of our plant laboratories. This room is air-conditioned to maintain and control constant climatic conditions (humidity and temperature). An atmospheric CO2 level of 400-450ppm was maintained.
The temperature was maintained at an average of 26°C during the day and lowered to an average of 23°C during the night. Room humidity was also kept constant between 60-70% during vegetative growth and between 50-60% during the generative phase (flowering) of the plants.
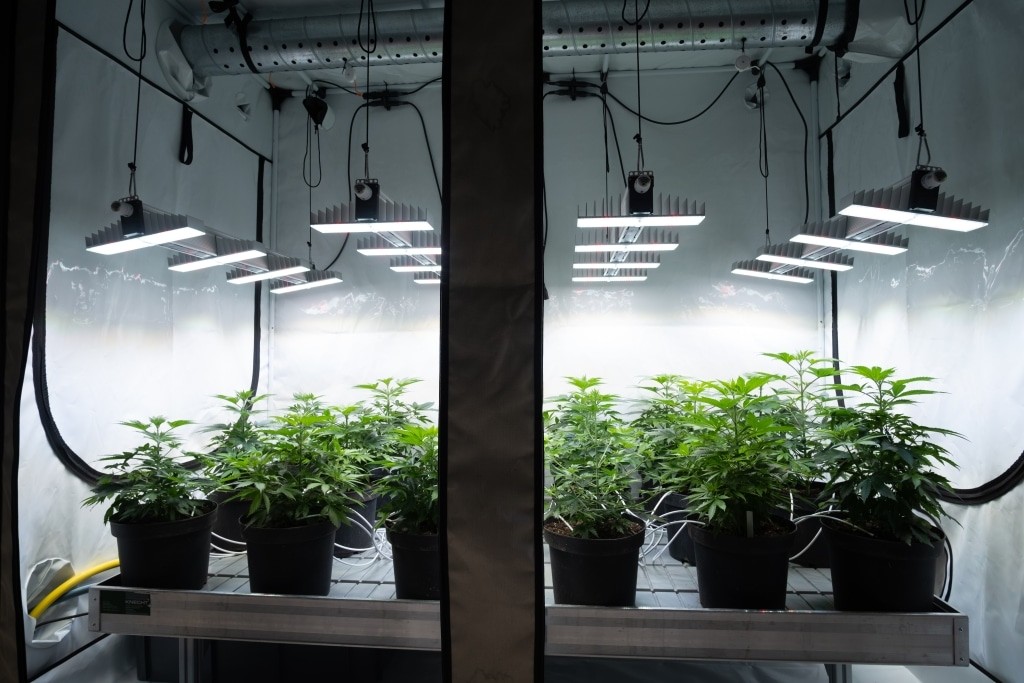
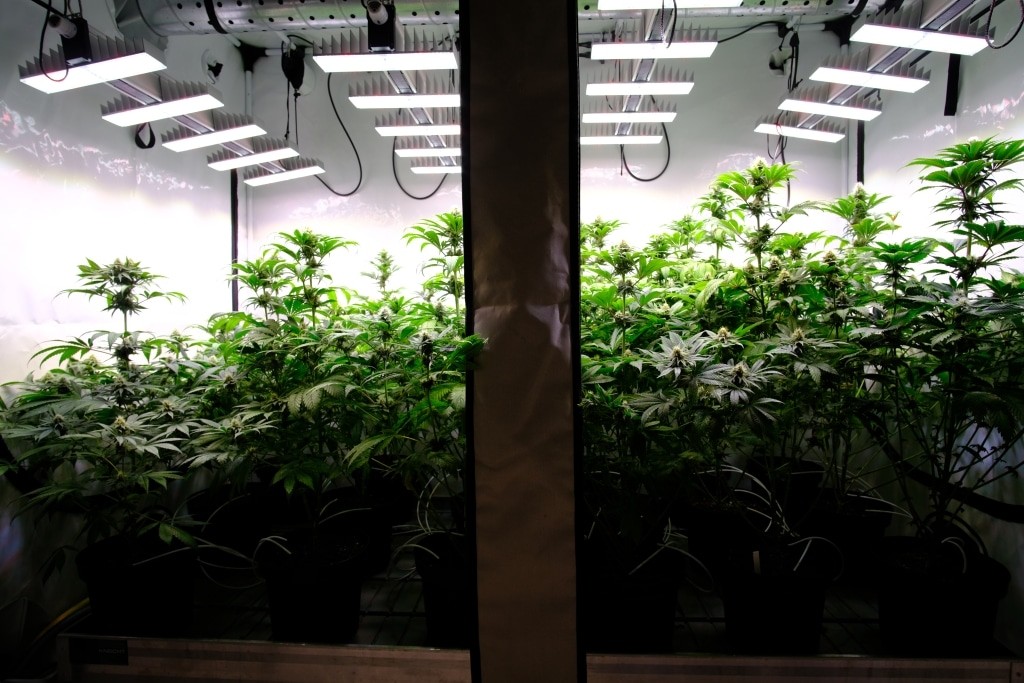
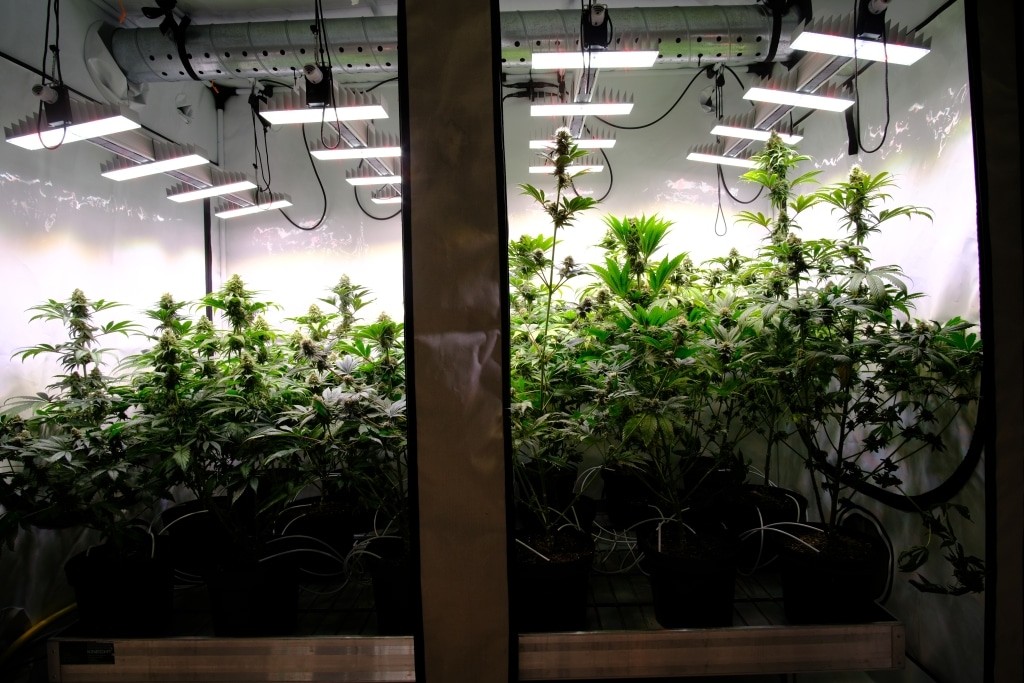
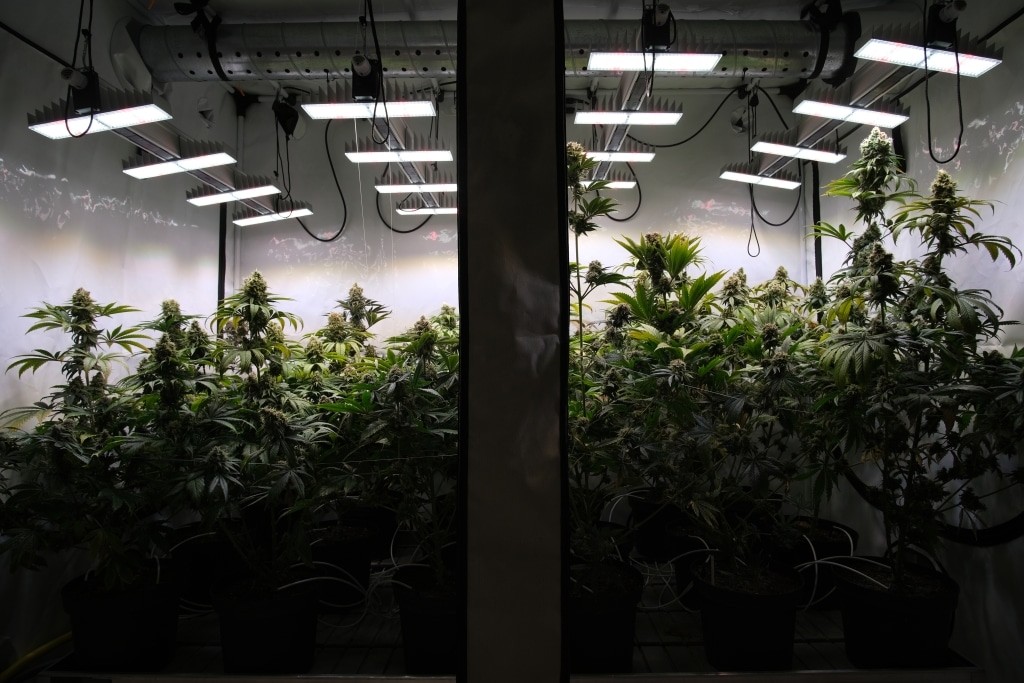
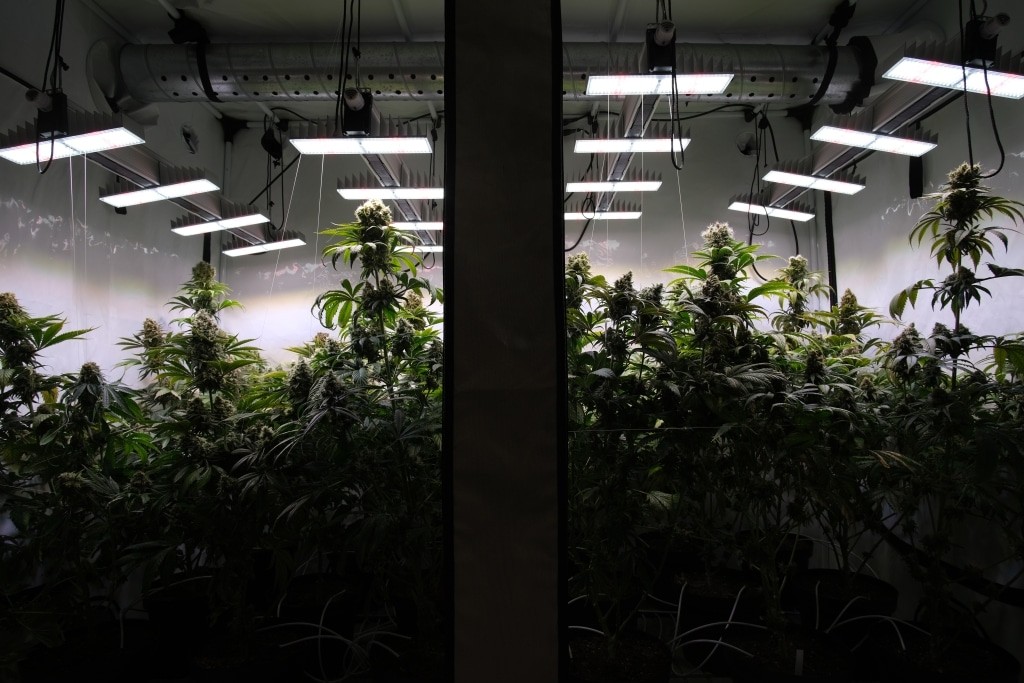
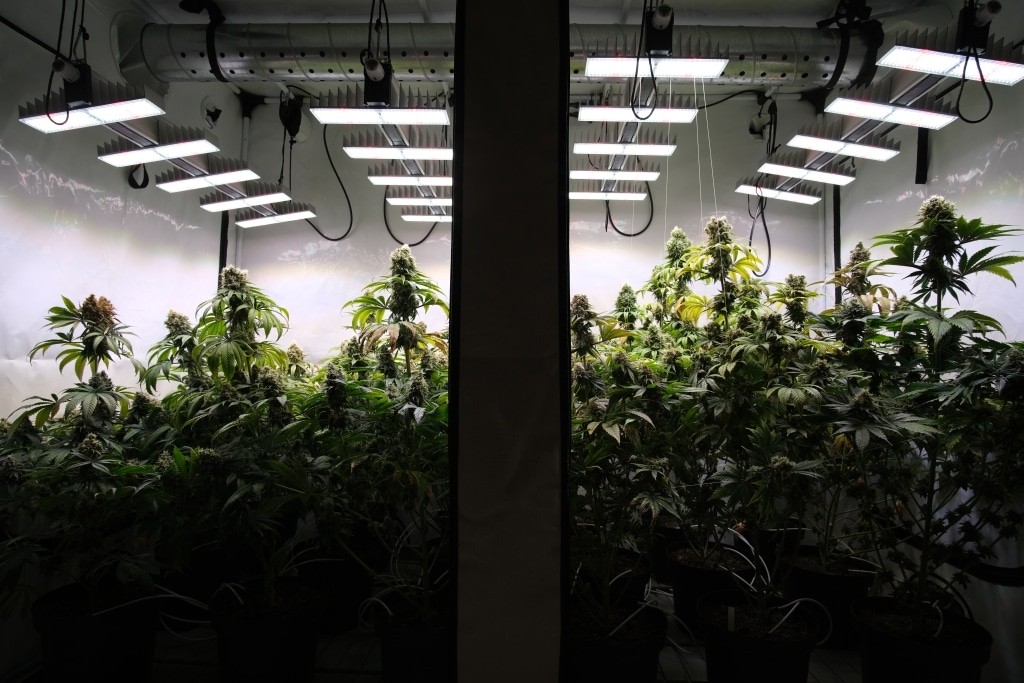
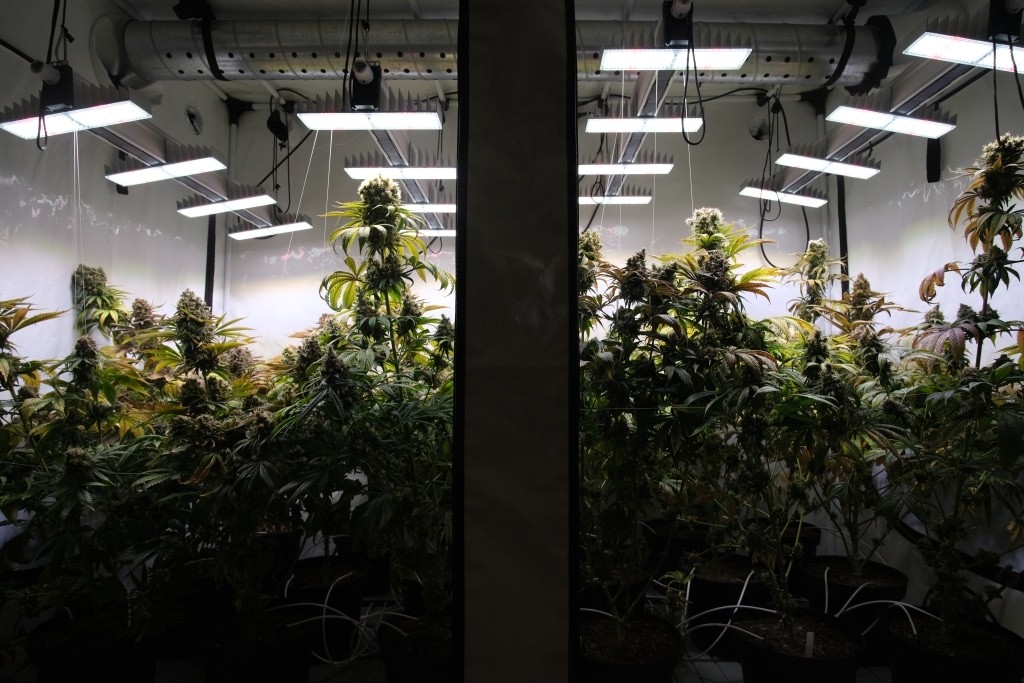
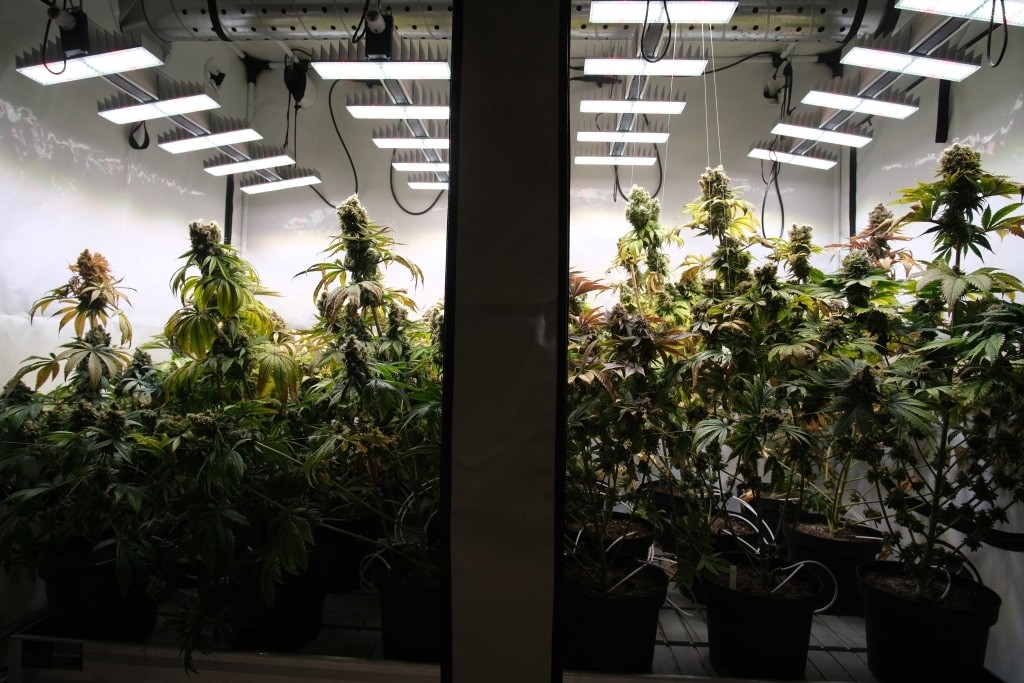
In order to eliminate interfering stray light between individual experiments, grow tents, “Homebox Ambient R240+” were used for the experiment. The grow chambers have a dimension of 2.4×1.2×2.2m (LxWxH), resulting in 2.88m² floor space and 6.3m³ volume. Nutrients were supplied by a central watering system via drip irrigation. This ensured that all plants received the same nutrients.
In order to pursue the goals of the experiment, several cultivation chambers were exposed to different light intensities. Therefore, we decided to use the two EVO models that were suitable for this purpose. EVO 4-120 and EVO 5-120, each designed for areas with a depth of 120cm. Grow chamber 1 was equipped with four EVO 5-120, grow chambers 2 and 3 were equipped with EVO 4-120. Chamber 3, which was equipped with four EVO 4-120, was to be operated at a maximum of 80% of the rated power.
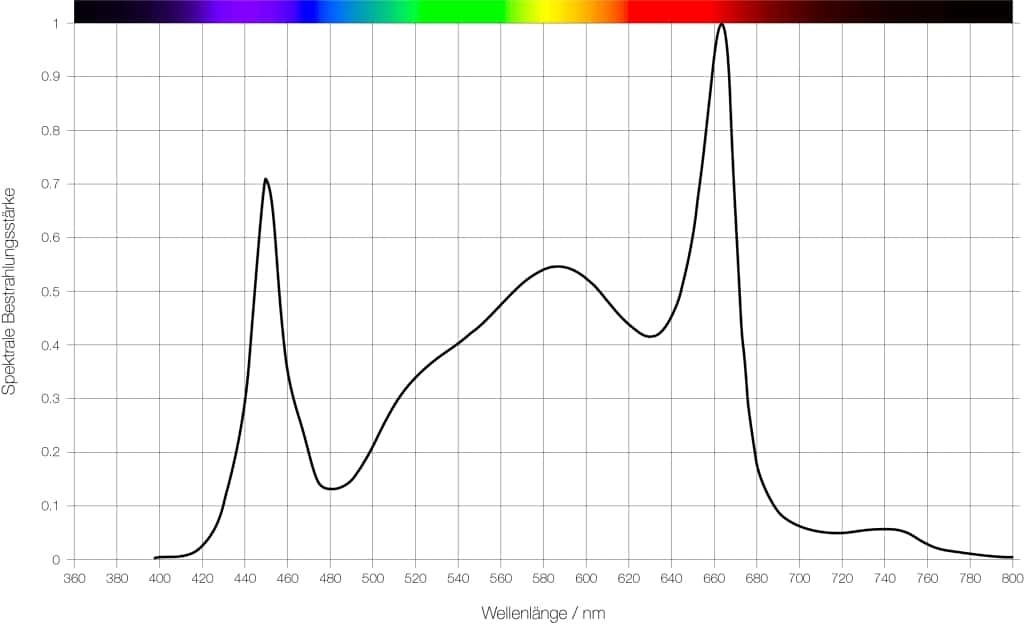
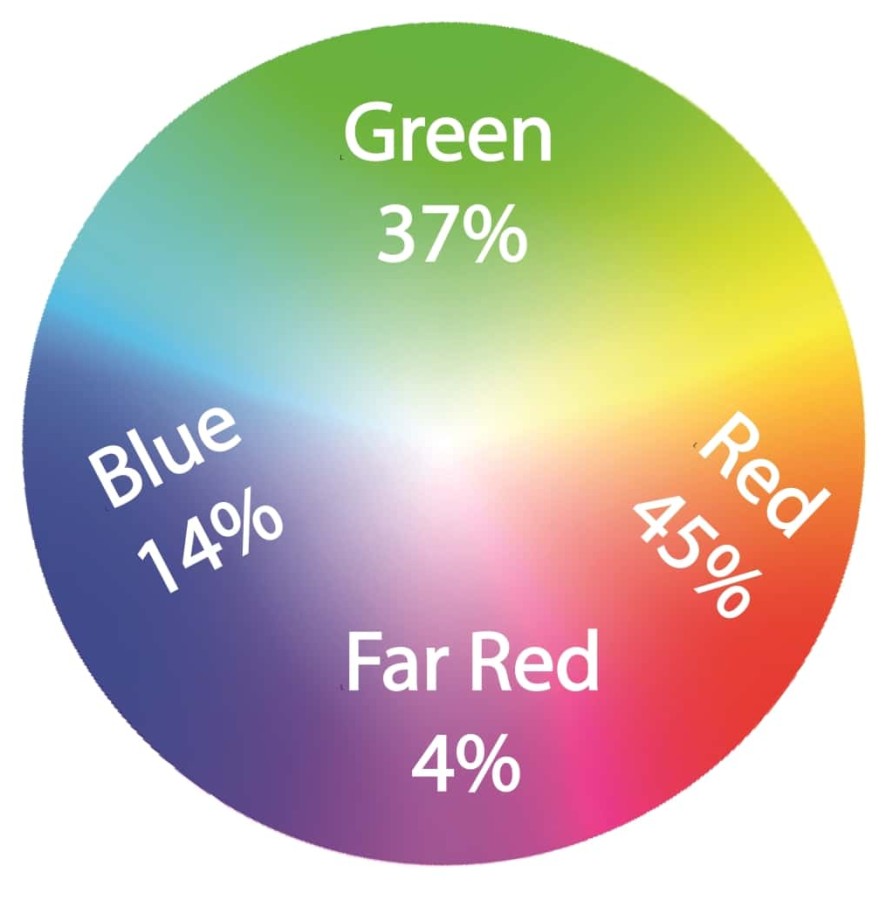
The EVO luminaires have the following spectral color distribution
– Blue 14%; – Green 37%; – Red 45%; – Far Red 4%
In advance, light simulations were carried out to determine the best possible positioning of the lights in the grow tent. We offer such simulations free of charge to our customers, so that they can also optimally illuminate their cultivation areas.
The aim of the test was to discuss the limit value of the maximum exposure intensity, at which the yield, under atmospheric CO2, no longer increases. Previous research, as well as internal experiments, showed that this maximum exposure intensity depends on the light spectrum used. For broadband light spectra, as used in the EVO-series, this value is theoretically about 1.000µmol/m²/s during 12 hours of illumination.
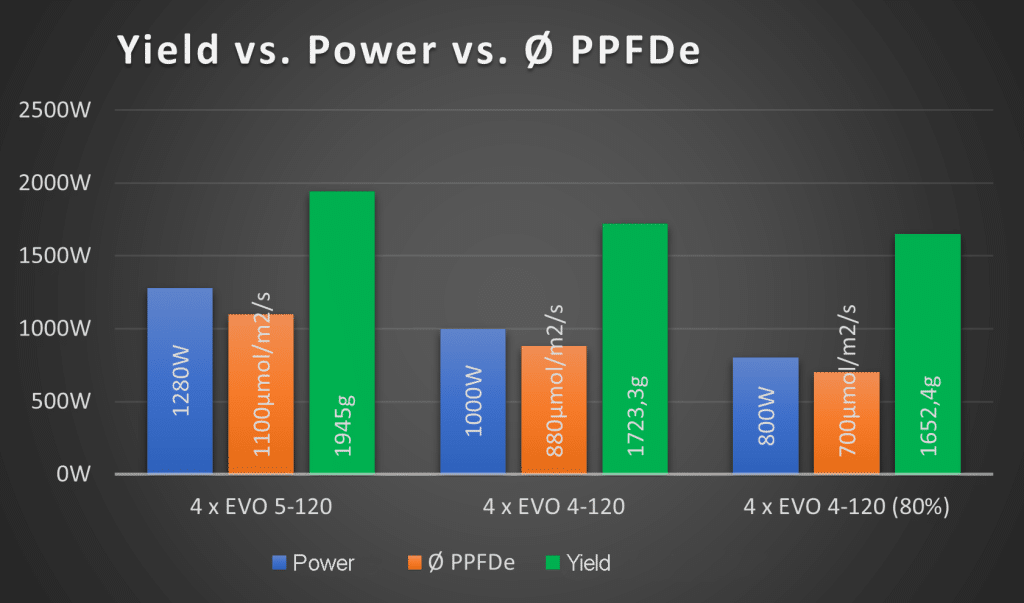
Four EVO 5-120 with a power consumption of 1.280W provide an average of 1.100µmol/m²/s homogeneously distributed over the cultivation area of 2.88m². Therefore, this lighting setup was used to expose the, most intensively exposed, cultivation chamber 1.
We work with the so-called PPFe or PPFDe. This means that we perform all our measurements in a wavelength range of 380-780nm.

2D Simulation of EVO 5-120
The other two breeding chambers were each equipped with four EVO 4-120. In cultivation chamber 2, the lights were operated with a maximum power of 1.000W (347W/m²). Average PPFDe values of 880µmol/m²/s were achieved. The third growth chamber should be exposed with an average PPFDe value of 700µmol/m²/s. For this purpose, the four pieces EVO 4-120 were operated with a maximum of 80% (800W) total power.

2D Simulation of EVO 4-120
Execution of the test
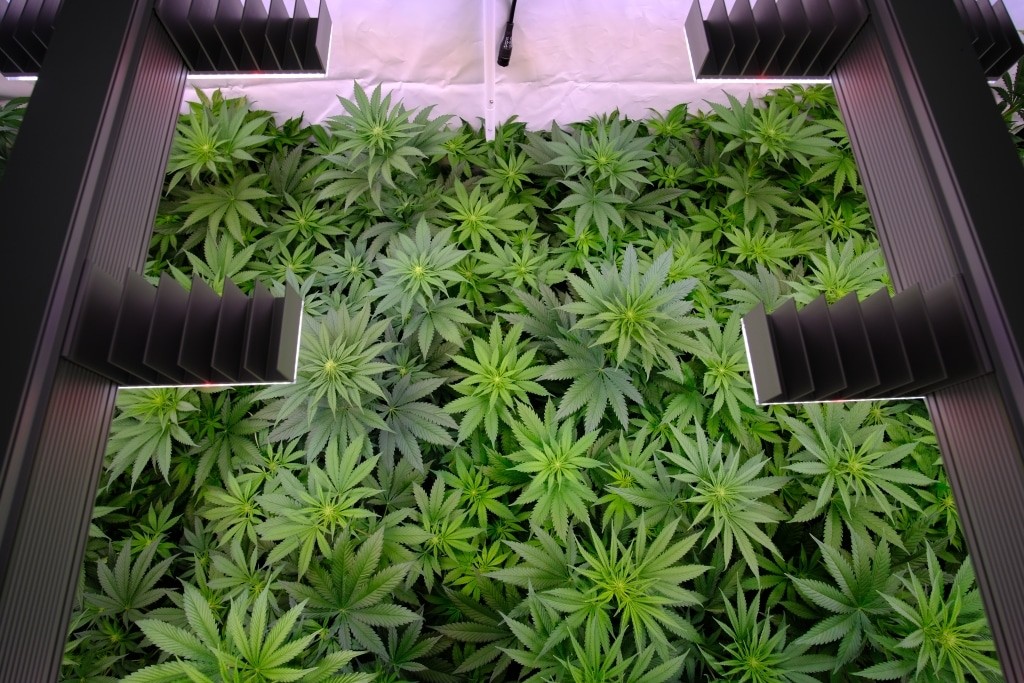
The three cultivation tents were each planted with 18 seed plants of the Cannabis Sativa L. CBD variety “Alpine Spirit x 403”.
The plants were planted in a soil substrate consisting of a mixture of white peat, coconut fiber, wood fiber, compost and perlite. The substrate was pre-fertilized with sheep wool fertilizer. Seed plants were planted in 7.5L pots and pre-grown in 1L pots.
During the course of the experiment, the plants were fed with a a three-component mineral fertilizer from “Advanced Hydroponics of Holland”. To guarantee a uniform as well as continuous irrigation, all growing chambers were supplied with a central automatic drip irrigation system.
All plants, after germination, were grown for 21 days at 18 hours per day. Depending on the phase, exposure was as described in the table below.

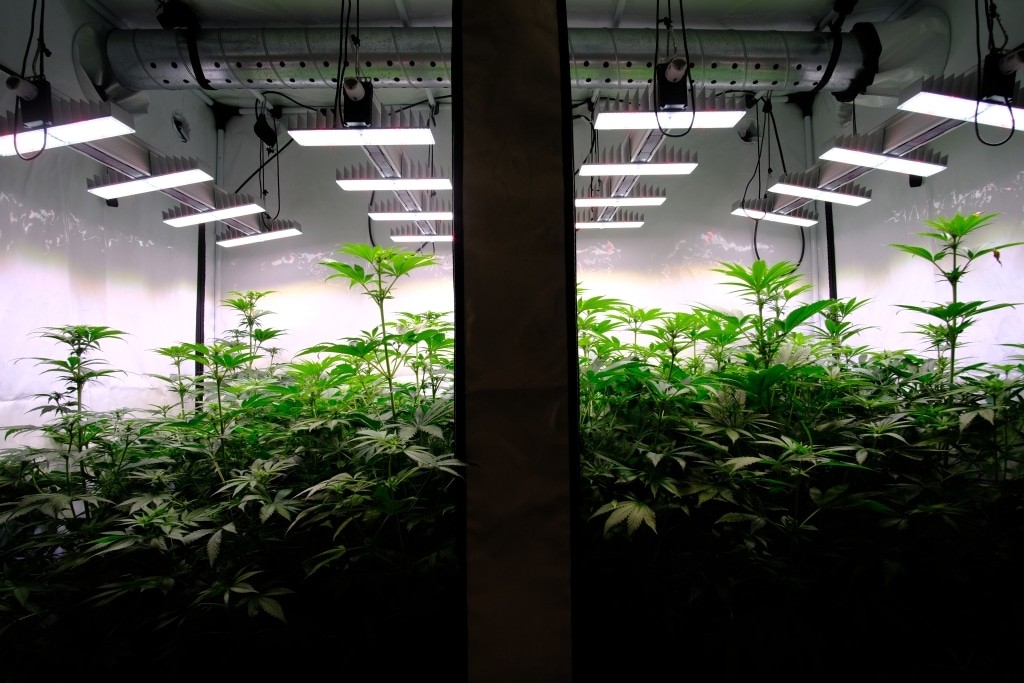
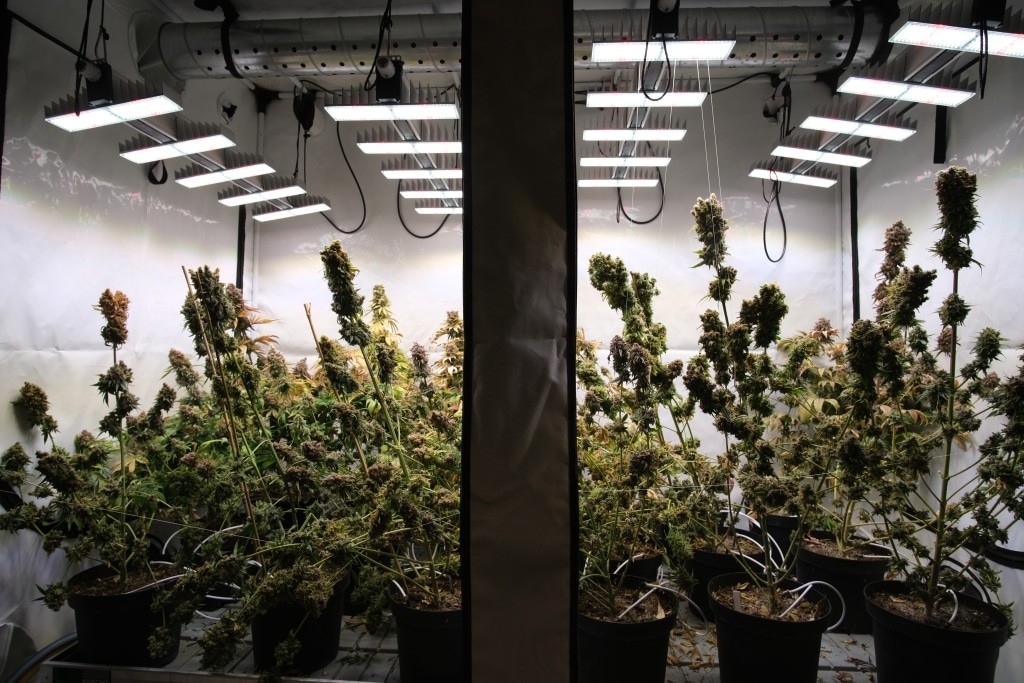
vegetative growth under the EVO-Series
| Day/Chamber | Chamber 1
Ø PPFDe Total input power 4 x EVO 5-120 |
Chamber 2
Ø PPFDe Total input power 4 x EVO 4-120 |
Chamber 3
Ø PPFDe Total input power 4 x EVO 4-120 |
| Day 1 – 6 (18h) | 300µmol/m²/s
350 Watt Power 24% DLI 19,44mol/m²/d |
300µmol/m²/s
350 Watt Power 35% DLI 19,44mol/m²/d |
300µmol/m²/s
350 Watt Power 35% DLI 19,44mol/m²/d |
| Day 7 – 21 (18h) | 400µmol/m²/s
450 Watt Power 35% DLI 25,92mol/m²/d |
400µmol/m²/s
450 Watt Power 45% DLI 25,92mol/m²/d |
400µmol/m²/s
450 Watt Power 45% DLI 25,92mol/m²/d |
At the beginning of the flowering phase, after the time switch from 18 to 12 hours of illumination daily, the light intensity was increased to 500µmol/m²/s in all cultivation chambers. This is to accustom the plants slowly to higher light intensities, and not to inhibit the plants too much in their height growth. This reduced the DLI from the original 25.92mol/m²/d (day) to 21.6mol/m²/d. After the first 14 days of flowering, the light intensity of the lights was increased to 100%, except for the third culture chamber, equipped with SANlight EVO 4-120, which were set to 80% of their rated power.
To check the light intensities as well as to adjust the lights appropriately, we use a spectroradiometer. At the height of the plant tips (Top of Crop = ToC), average light intensities of approx. 1.100µmol/m²/s were measured in chamber 1 with the EVO 5-120 lights. This results in a DLI of 47.52mol/m²/d, indicating more than the maximum amount of light that, according to common knowledge, plants can still process at optimal climatic values without CO2 supplementation.
In chamber #2 with the EVO 4-120 at 100% power, average intensities of approximately 880µmol/m²/s were measured, resulting in a DLI of 38.01mol/m²/d. In tent #3, the EVO 4-120 were operated at 80%. Here, average illumination intensities at height ToC of about 700µmol/m²/s could be measured. For twelve hours of illumination, this results in an average DLI of 30.24mol/m²/d.
The table below shows the corresponding PPFDe values, as well as the power consumption at the corresponding dimming settings.

| Day/Chamber | Chamber 1
Ø PPFDe Total input power 4 x EVO 5-120 |
Chamber 2
Ø PPFDe Total input power 4 x EVO 4-120 |
Chamber 3
Ø PPFDe Total input power 4 x EVO 4-120 |
| Day 22 – 28 (12h) | 500µmol/m²/s
580 Watt Power 45% DLI 21,6mol/m²/d |
500µmol/m²/s
580 Watt Power 52% DLI 21,6mol/m²/d |
500µmol/m²/s
580 Watt Power 52% DLI 21,6mol/m²/d |
| Day 29 – 36 (12h) | 500µmol/m²/s
580 Watt Power 45% DLI 21,6mol/m²/d |
500µmol/m²/s
580 Watt Power 52% DLI 21,6mol/m²/d |
500µmol/m²/s
580 Watt Power 52% DLI 21,6mol/m²/d |
| Day 37 – 43 (12h) | 1.100µmol/m²/s
1.280 Watt Power 100% DLI 47,52mol/m²/d |
880µmol/m²/s
1.000 Watt Power 100% DLI 38,01mol/m²/d |
700µmol/m²/s
800 Watt Power 80% DLI 30,24mol/m²/d |
| Day 44 – 50 (12h) | 1.100µmol/m²/s
1.280 Watt Power 100% DLI 47,52mol/m²/d |
880µmol/m²/s
1.000 Watt Power 100% DLI 38,01mol/m²/d |
700µmol/m²/s
800 Watt Power 80% DLI 30,24mol/m²/d |
| Day 51 – 57 (12h) | 1.100µmol/m²/s
1.280 Watt Power 100% DLI 47,52mol/m²/d |
880µmol/m²/s
1.000 Watt Power 100% DLI 38,01mol/m²/d |
700µmol/m²/s
800 Watt Power 80% DLI 30,24mol/m²/d |
| Day 58 – 64 (12h) | 1.100µmol/m²/s
1.280 Watt Power 100% DLI 47,52mol/m²/d |
880µmol/m²/s
1.000 Watt Power 100% DLI 38,01mol/m²/d |
700µmol/m²/s
800 Watt Power 80% DLI 30,24mol/m²/d |
| Day 65 – 71 (12h) | 1.100µmol/m²/s
1.280 Watt Power 100% DLI 47,52mol/m²/d |
880µmol/m²/s
1.000 Watt Power 100% DLI 38,01mol/m²/d |
700µmol/m²/s
800 Watt Power 80% DLI 30,24mol/m²/d |
| Day 71 – 77 (12h) | 1.100µmol/m²/s
1.280 Watt Power 100% DLI 47,52mol/m²/d |
880µmol/m²/s
1.000 Watt Power 100% DLI 38,01mol/m²/d |
700µmol/m²/s
800 Watt Power 80% DLI 30,24mol/m²/d |
| Day 78 – 84 (12h) | 1.100µmol/m²/s
1.280 Watt Power 100% DLI 47,52mol/m²/d |
880µmol/m²/s
1.000 Watt Power 100% DLI 38,01mol/m²/d |
700µmol/m²/s
800 Watt Power 80% DLI 30,24mol/m²/d |
| Day 85 – 91 (12h) | 1.100µmol/m²/s
1.280 Watt Power 100% DLI 47,52mol/m²/d |
880µmol/m²/s
1.000 Watt Power 100% DLI 38,01mol/m²/d |
700µmol/m²/s
800 Watt Power 80% DLI 30,24mol/m²/d |
| Day 92 – 98 (12h) | 1.100µmol/m²/s
1.280 Watt Power 100% DLI 47,52mol/m²/d |
880µmol/m²/s
1.000 Watt Power 100% DLI 38,01mol/m²/d |
700µmol/m²/s
800 Watt Power 80% DLI 30,24mol/m²/d |
The plants were not additionally defoliated during the cultivation and only a few tending shoots as well as cyclically dying leaves were removed from the lower part of the plants.
Due to the pre-fertilization of the substrate, the EC value of the irrigation water was initially kept low at 0.9 – 1.2 EC during vegetative growth and slowly increased to 1.4 EC over the course of the weeks. During the flowering of the plants, the EC value of the irrigation water was cyclically increased up to 1.8 EC. This corresponds to the average values for fertilizing Cannabis Sativa L. The last two weeks of flowering, the substrate was watered only with pH regulated water with a value of 0.4 EC.
| Light exposure [h] | 18 | 18 | 18 | 12 | 12 | 12 | 12 | 12 | 12 | 12 | 12 | 12 | 12 | 12 |
| Nutrient solution week | 1 | 2 | 3 | 4 | 5 | 6 | 7 | 8 | 9 | 10 | 11 | 12 | 13 | 14 |
| Grow [ml] | 31 | 94 | 265 | 302 | 680 | 453,6 | 226,8 | 245,7 | 0 | 0 | 0 | 0 | 0 | 0 |
| Bloom [ml] | 31 | 47 | 132 | 151 | 340 | 907 | 1134 | 1228 | 1474 | 1474 | 1360 | 1020 | 0 | 0 |
| Micro [ml] | 31 | 47 | 132 | 151 | 340 | 453 | 567 | 614 | 491 | 491 | 453 | 340 | 0 | 0 |
| EC | 0,7 | 0,9 | 1,2 | 1,2 | 1,4 | 1,4 | 1,5 | 1,5 | 1,7 | 1,7 | 1,7 | 1,7 | 0,4 | 0,4 |
| PH | 6,3 | 6,3 | 6,2 | 6,2 | 5,8 | 6 | 5,8 | 6 | 5,8 | 5,9 | 6 | 5,9 | 5,8 | 5,8 |
| Casting quantity per day | 0,3 | 0,5 | 0,7 | 0,8 | 0,9 | 1,2 | 1,3 | 1,3 | 1,3 | 1,3 | 1,2 | 0,9 | 0,9 | 0,5 |
| Casting quantity per week | 125 | 189 | 265 | 302 | 340 | 454 | 454 | 491 | 491 | 491 | 454 | 340 | 340 | 189 |
Light intensity vs. height growth and cell strength.
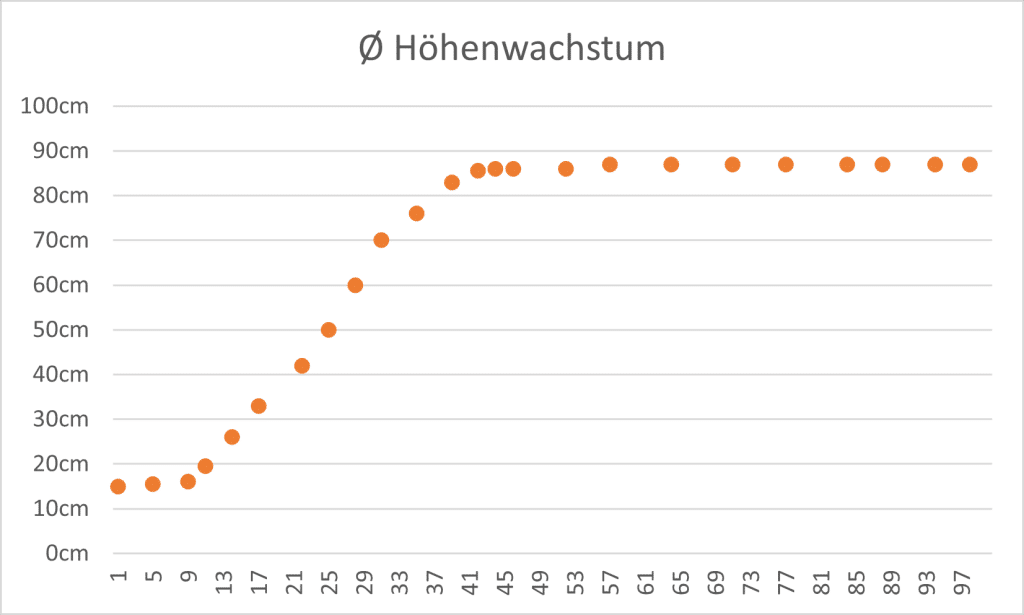
The plants were distributed into the individual chambers with an average height of 15cm. Height growth in the vegetative stages was similar for all plants. As expected, after the time change from 18 to 12 hours of exposure time, the plants started with more elongation of the internodes due to the lowered DLI, which stabilized within two weeks.
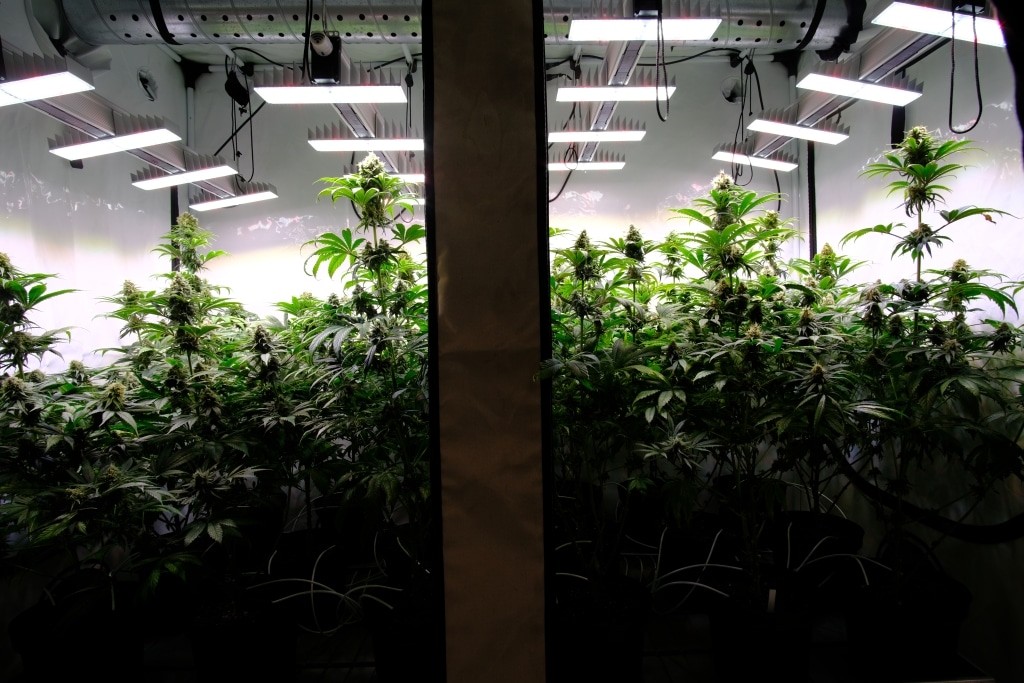
The seed plants reached an average height of 87cm. After the elongation phase due to flower initiation, little height growth occurred in most plants. Plants under the high intensity of EVO 5-120 remained on average 5% lower and stockier than plants in chambers 2 and 3.
It is worth mentioning the evidence that cell strength increased at higher intensities. Thus, the stems of the plants under the highest intensities were noticeably stronger than the stems of plants under the lower light intensities.
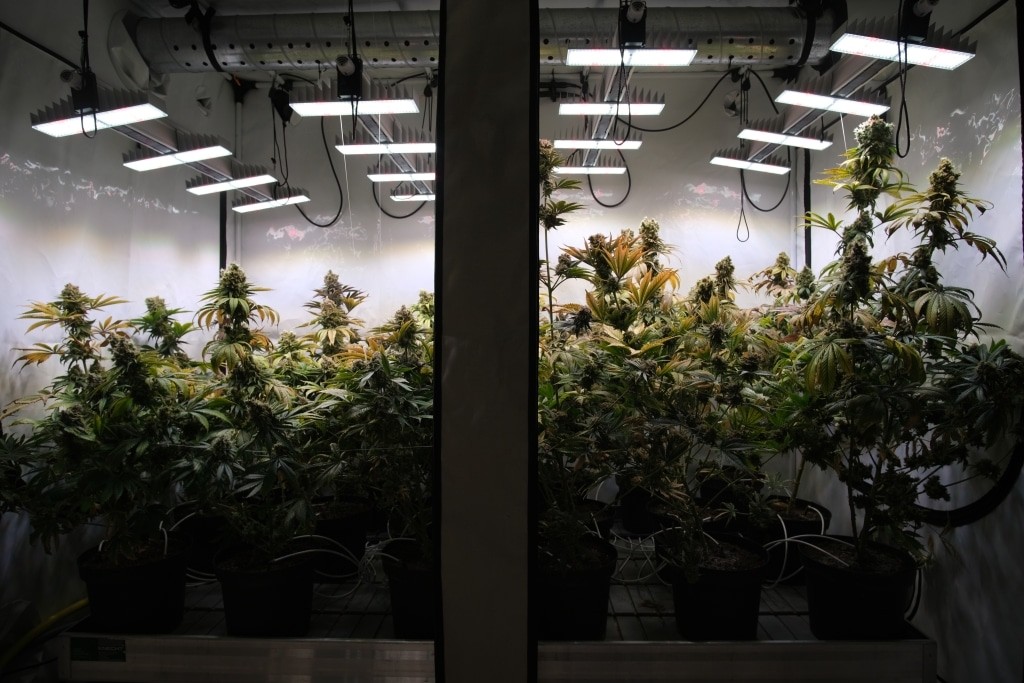
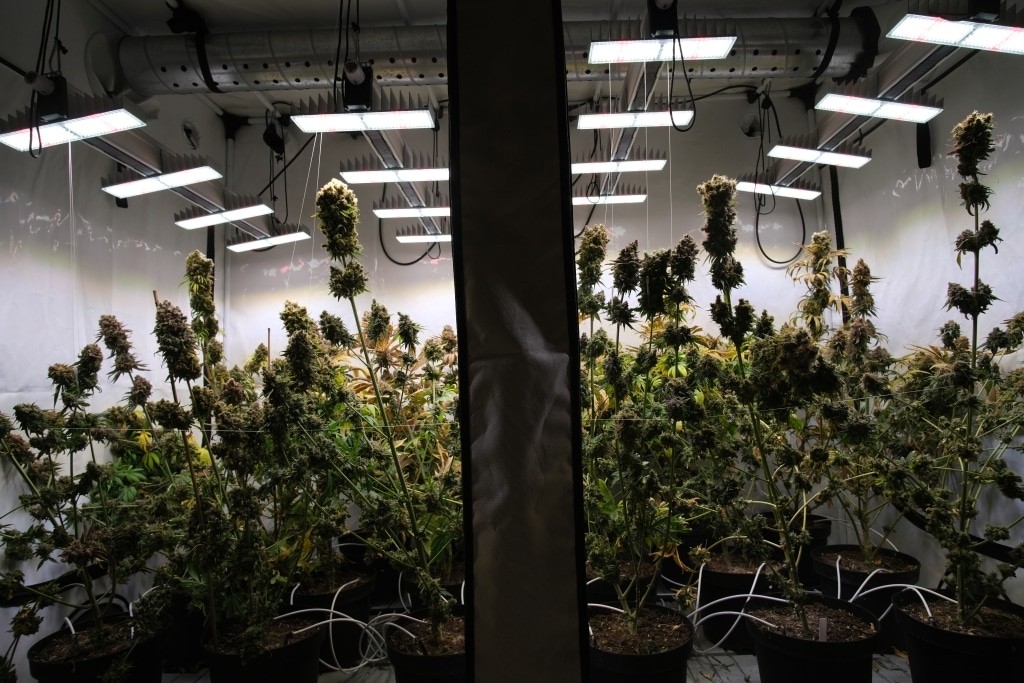
Bleaching
In this experiment, it was important to find out at which light intensity the plants start to bleach, as this is associated with a loss of optical quality of the cannabis flowers.
At the time of harvest, in chamber 1, seven plants showed signs of bleaching and eleven plants did not. In the second tent, six plants showed these signs and twelve did not. In the third and final chamber with the EVO 4-120 at 80%, only three plants showed signs of bleaching, whereas 15 of the plants looked normal.
| Chamber | Model | Ø PPFDe | # of 18 plants with bleaching |
| 1 | 4 x EVO 5-120 | 1.100µmol/m²/s | 7 |
| 2 | 4 x EVO 4-120 | 880µmol/m²/s | 6 |
| 3 | 4 x EVO 4-120 (80%) | 700µmol/m²/s | 3 |

bleaching bud under the EVO-Series
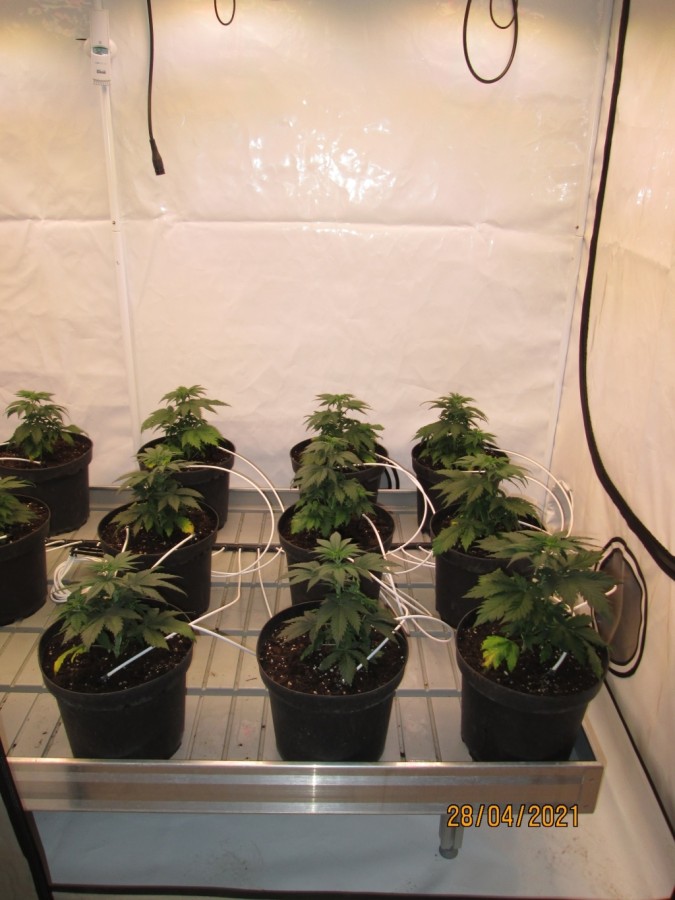
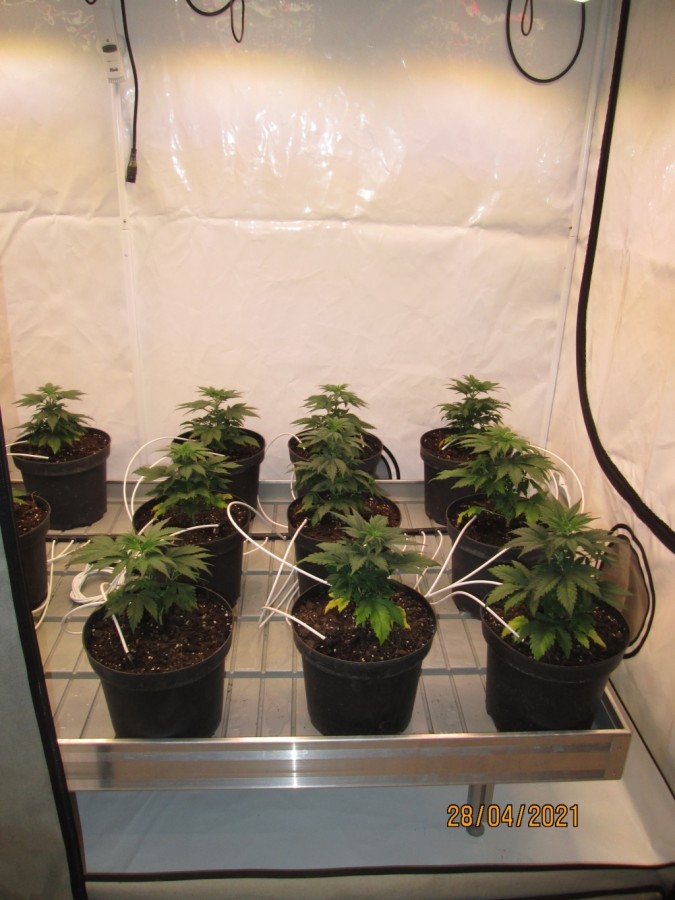
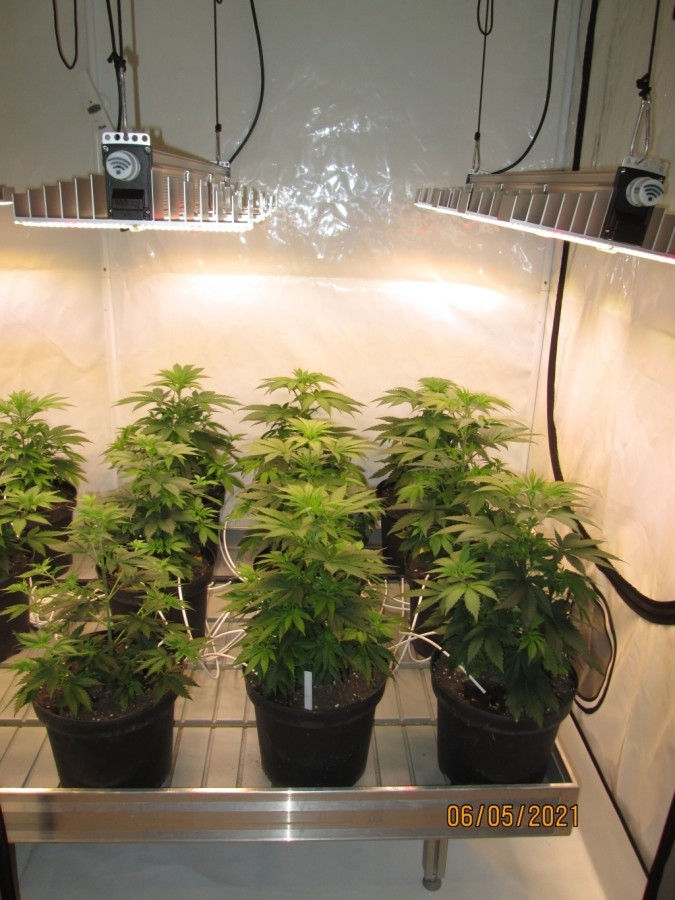
Documentation Day 7 - 14
Exposure time: 18 hours daily
Ø PPFDe 400µmol/m²/s
DLI 25,92mol/m²/d
temperature: 26°C room humidity: 70%
The light intensity in the tents was set to 300µmol/m²/s at the beginning. From the 8th day, the PPFDe was increased to 400µmol/m²/s.
Plants recovered from transplanting from 1 L to 7 L pots and started new growth.
Root growth has started. The root system is now starting to supply the plants with sufficient nutrients.
Due to the organic pre-fertilization of the substrate, slight signs of overfertilization appear on a few plants.
The plants get a daily amount of water of 500ml per day and plant. Watering is done with a light fertilizer solution of 0.9 EC at a pH of 6.3.
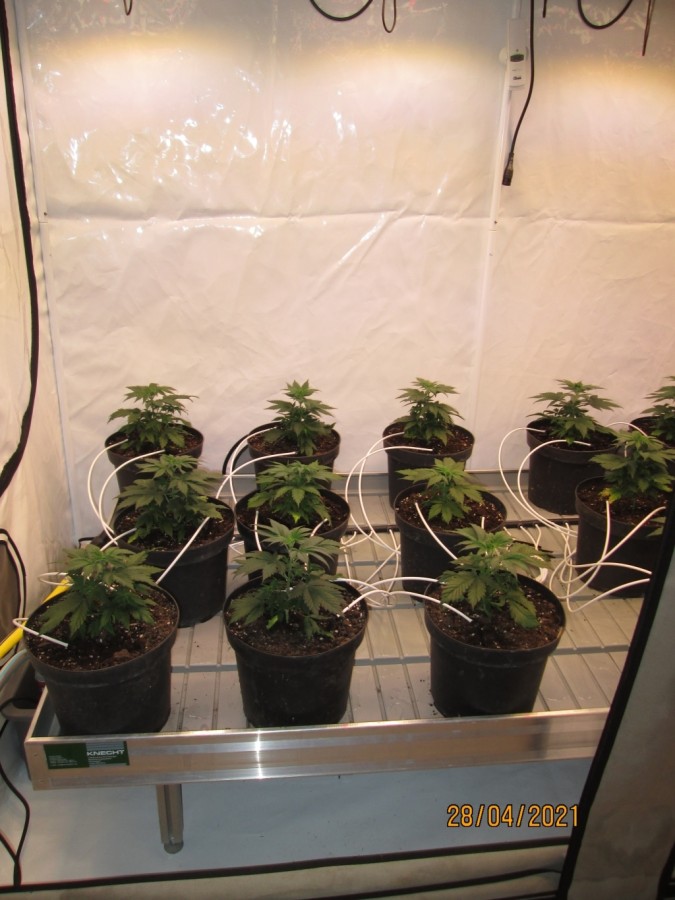
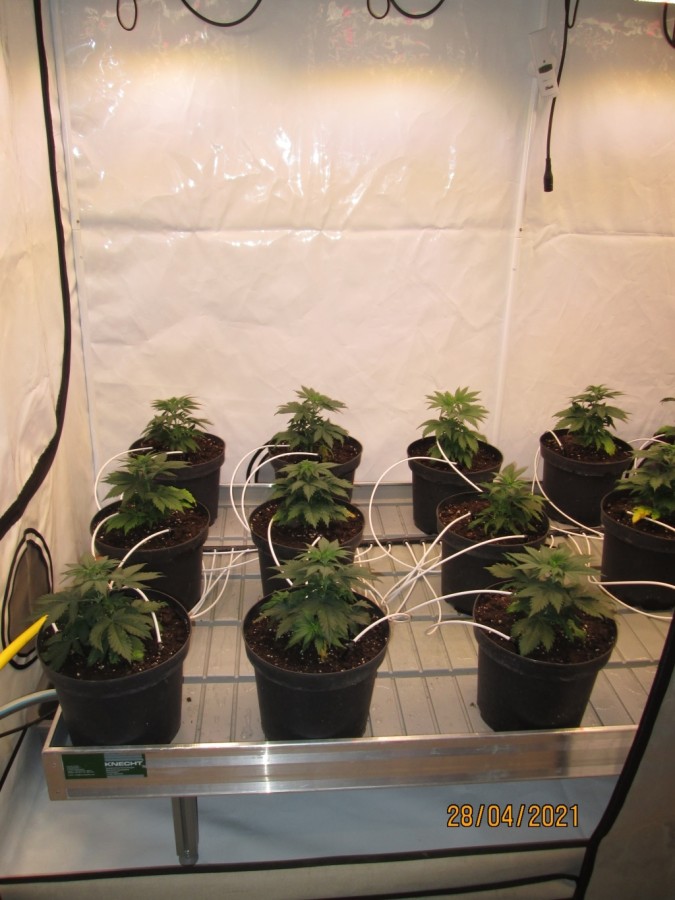
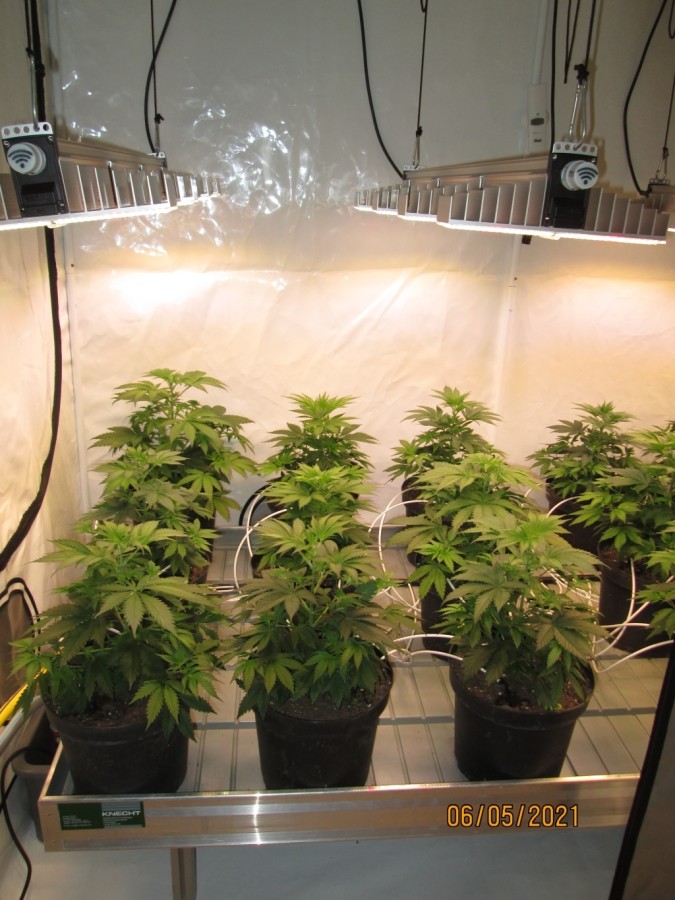
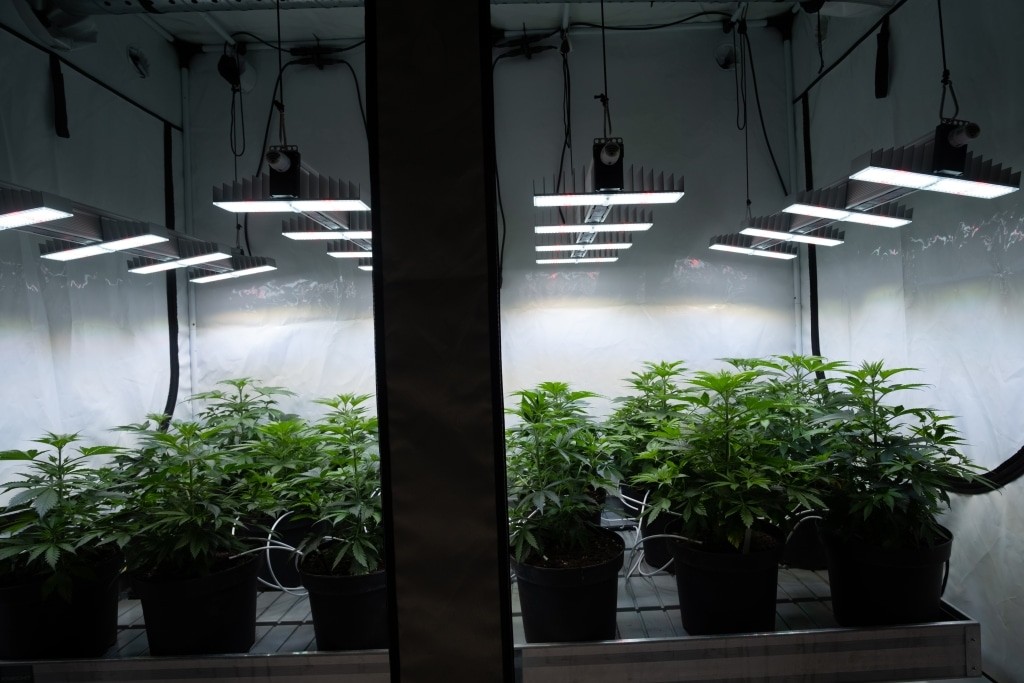
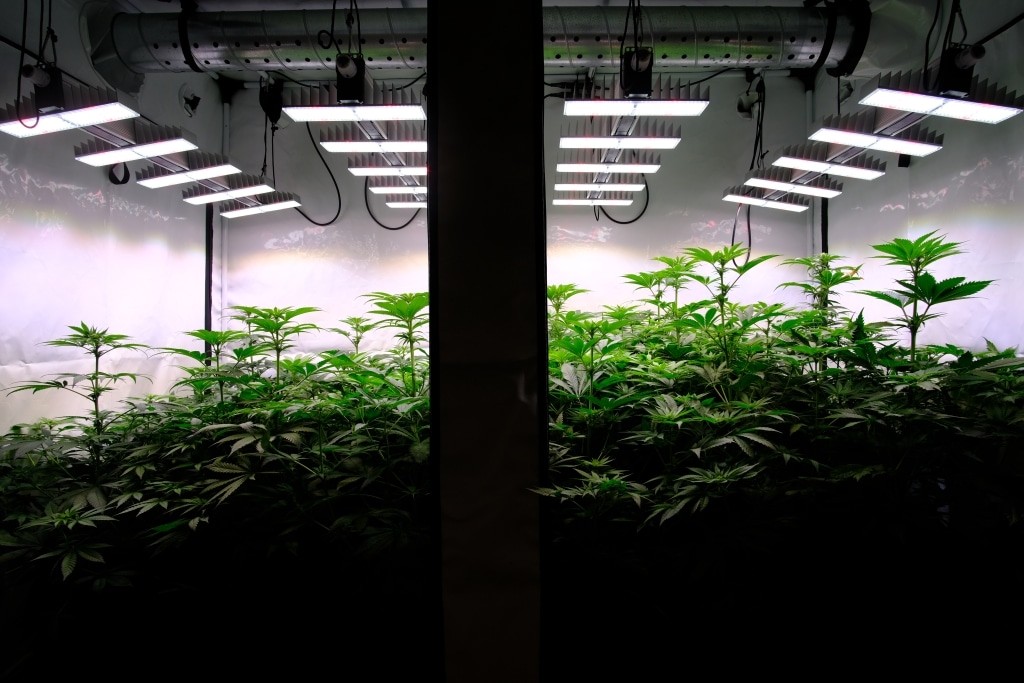
Documentation day 15 - 21
Exposure time: 18 hours daily
Ø PPFDe 400µmol/m²/s
DLI 25,92mol/m²/d
Temperature: 26°C Room humidity: 70%
Light intensity is still set to 400µmol/m²/s.
The plants show strong compact growth.
The plants get a daily water amount of 700ml per day and plant.
Watering is done with a light fertilizer solution of 1.2 EC at a pH of 6.2.
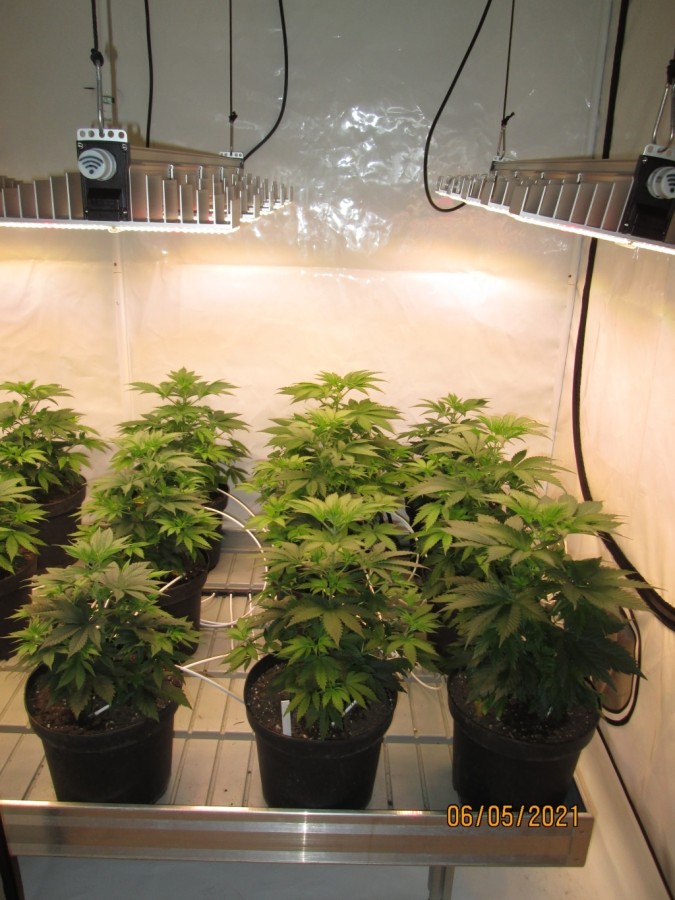
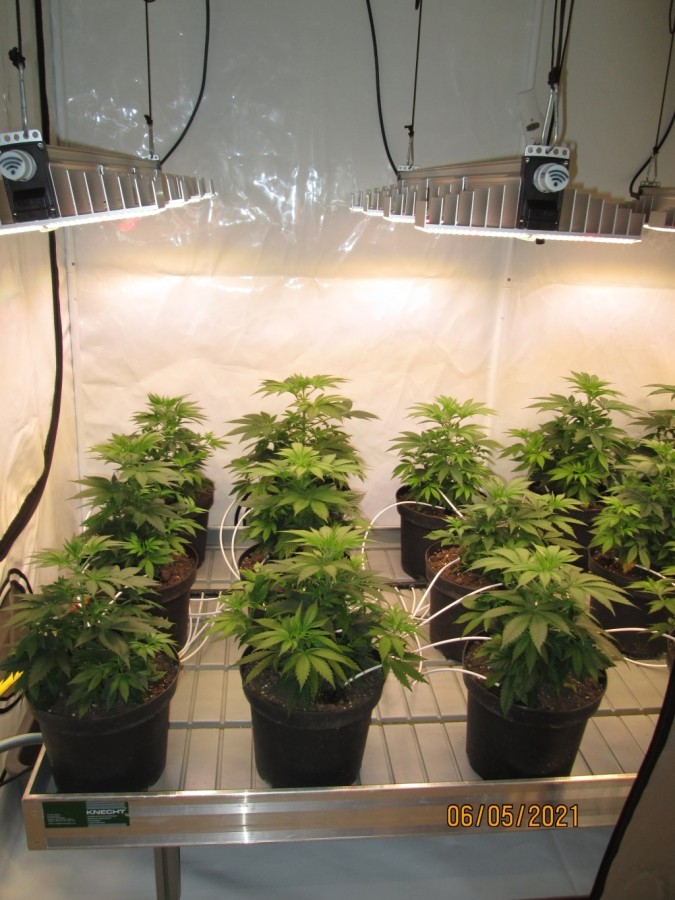
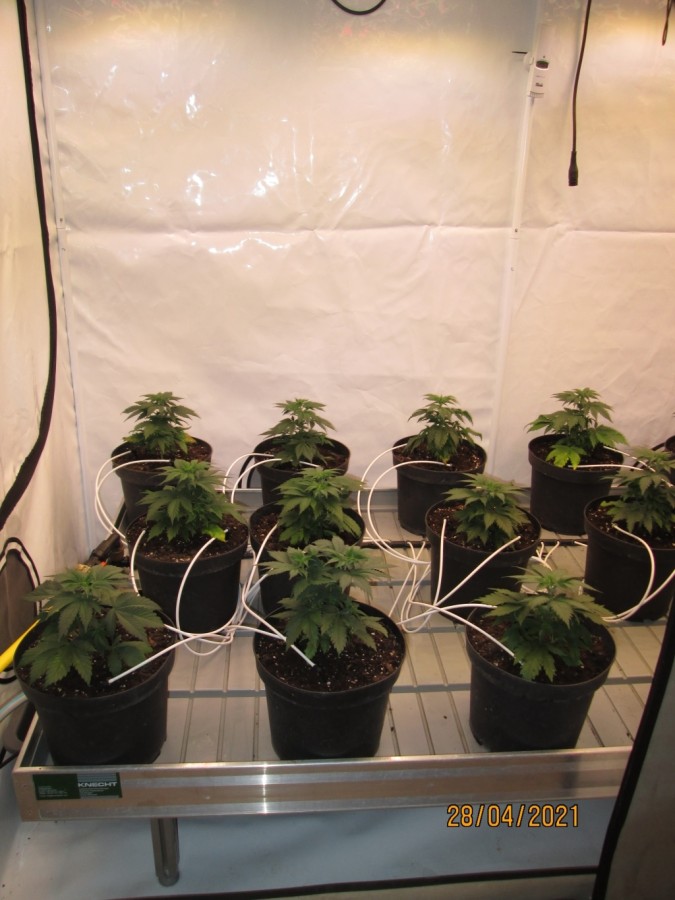
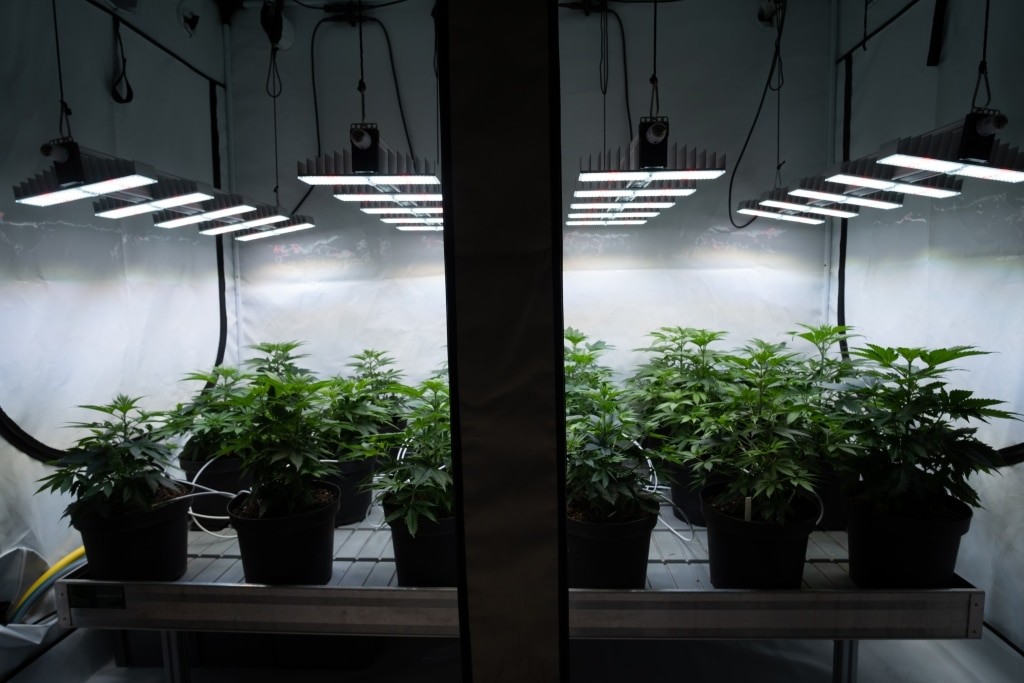
Documentation day 22 to 28, 1st week of flowering
Exposure time: 12 hours daily
Ø PPFDe 500µmol/m²/s
DLI 21,6mol/m²/s
Temperature: 26°C Room humidity: 70%
Light intensity was slightly increased from 400µmol/m²/s to 500µmol/m²/s.
The plants are now starting to develop more lateral shoots.
The morphological development is as expected.
The leaves have a strong structure and healthy leaf color.
The plants receive a daily water amount of 800ml per day per plant.
Watering is done with a light fertilizer solution of 1.2 EC at a pH of 6.2.
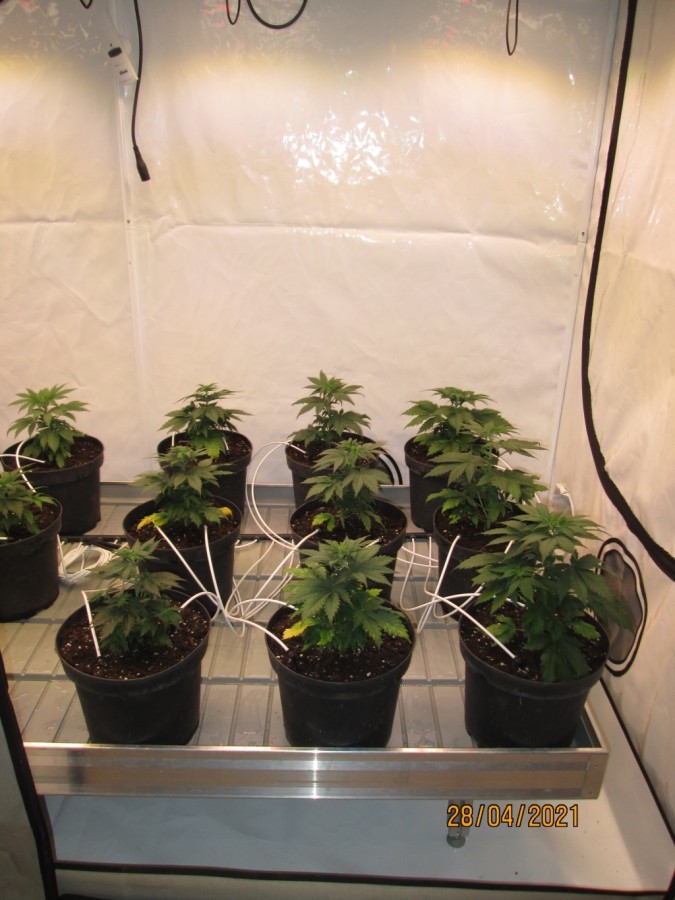
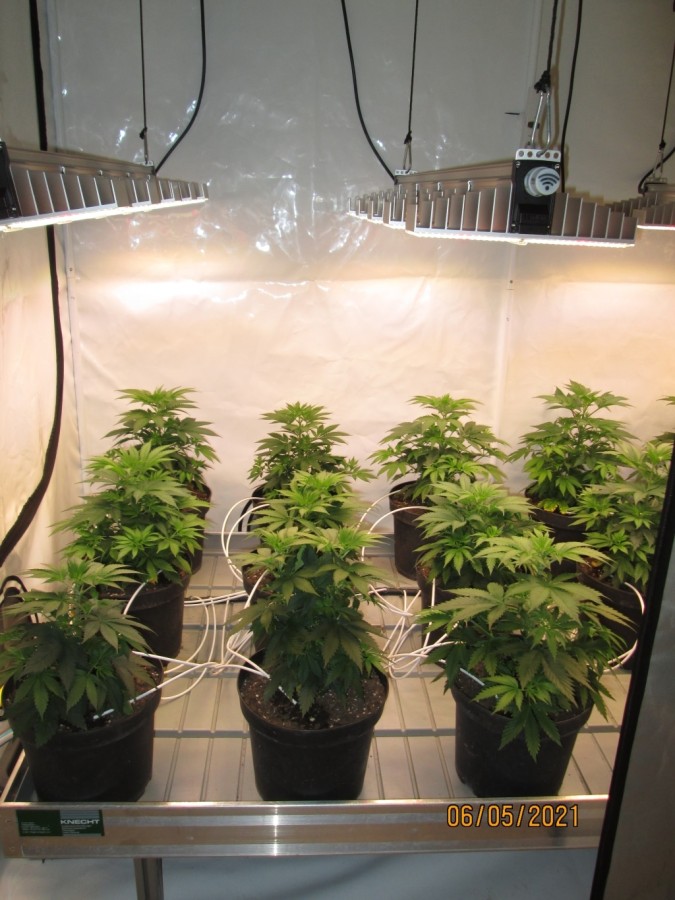
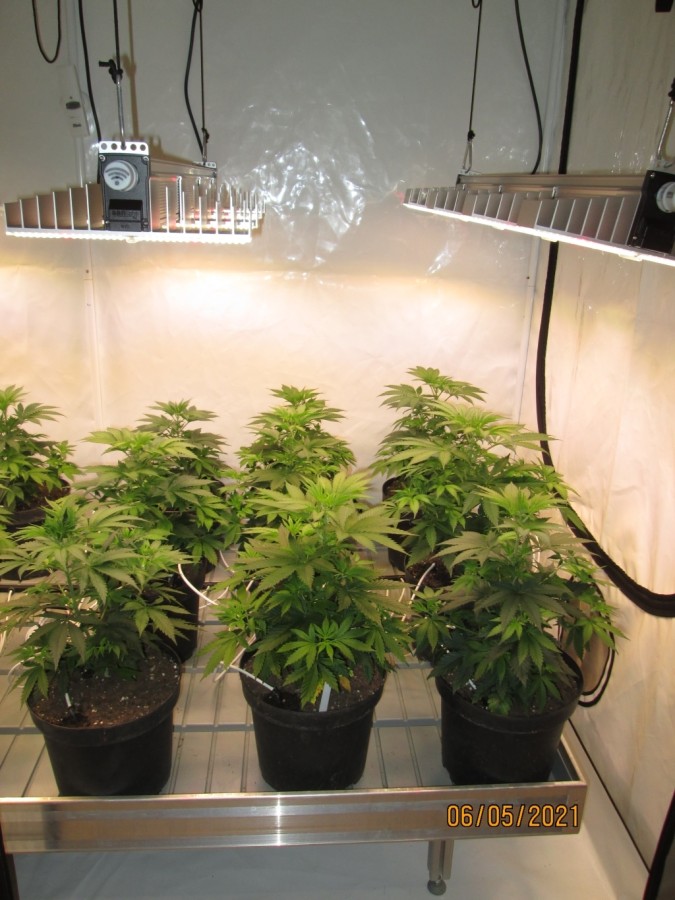
Documentation day 29 - 35, 2nd week of flowering
Exposure time: 12 hours daily
Ø PPFDe 500µmol/m²/s
DLI 21,6mol/m²/s
Temperature: 26°C Room humidity: 65%.
The light intensity was increased from 500µmol/m²/s to the maximum power of the lights.
Tent No. 1, EVO 5-120 ~1.100µmol/m²/s. Tent No. 2, EVO 4-120 ~850µmol/m²/s.
Tent No. 3, EVO 4-120 to 80% ~650µmol/m²/s.
The plants are now in a strong elongation phase and the nodal spacing is starting to lengthen noticeably. Growth is still very satisfactory.
The plants are developing vigorously and no longer show signs of over-fertilization.
The plants get a daily water amount of 900ml per day and plant.
Watered with a light fertilizer solution of 1.4 EC at a pH of 6.2.
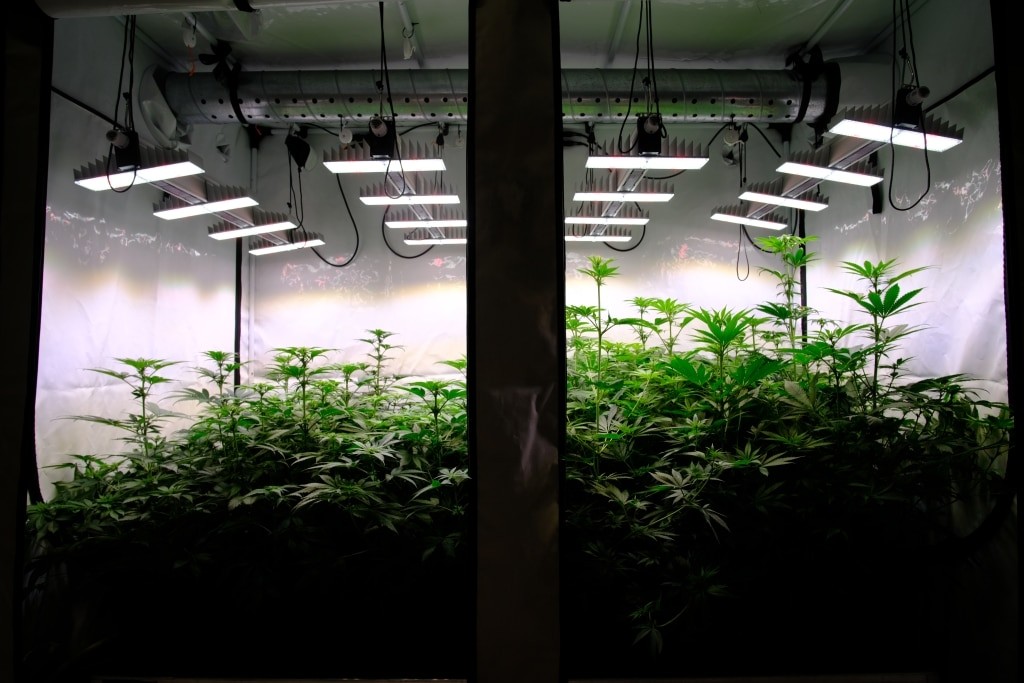
Documentation day 51 - 57, 5th flower week
Exposure time: 12 hours per day
Ø PPFDe
Tent 1 1.100µmol/m²/s
Tent 2 880µmol/m²/s
Tent 3 700µmol/m²/s
DLI
Tent 1 47.52mol/m²/d
Tent 2 38.01mol/m²/d
Tent 3 30,24mol/m²/d
Temperature: 26°C Room humidity: 60%
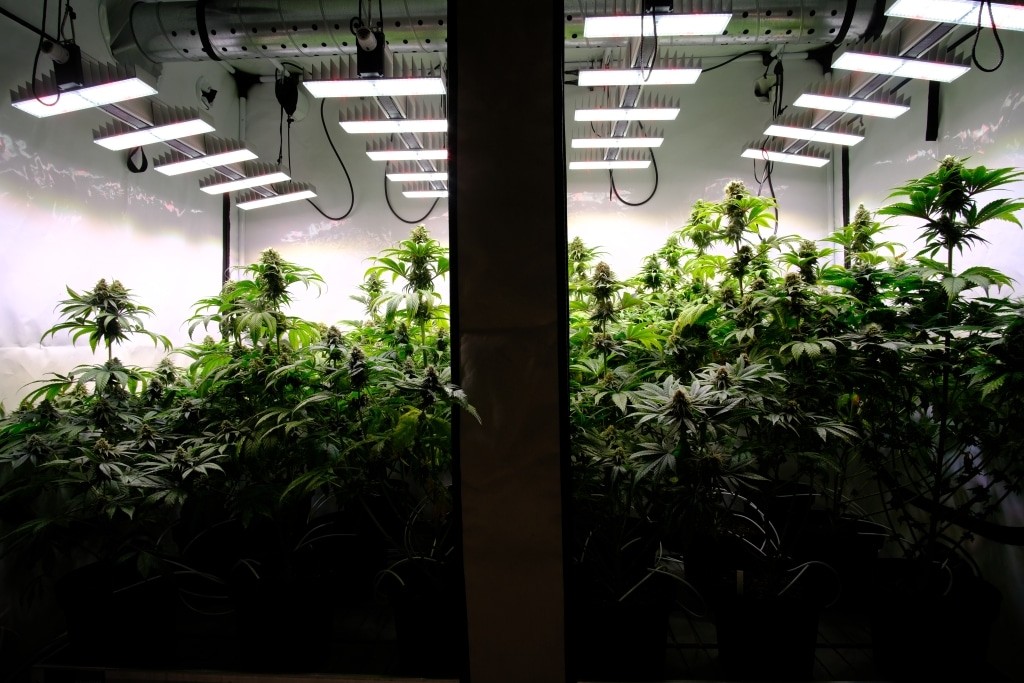
The plants tolerate all administered light intensities very well, even though bleaching starts in some plants especially under the high intensities.
The stretching phase is over and the plants have now reached the main flowering phase.
The plants have reached their final height and the volume of the flowers is increasing.
The morphological development of the plants is very good.
The plants get a daily amount of water of 1.300ml per day per plant.
Watering is done with a light fertilizer solution of 1.5 EC at a pH of 6.0.
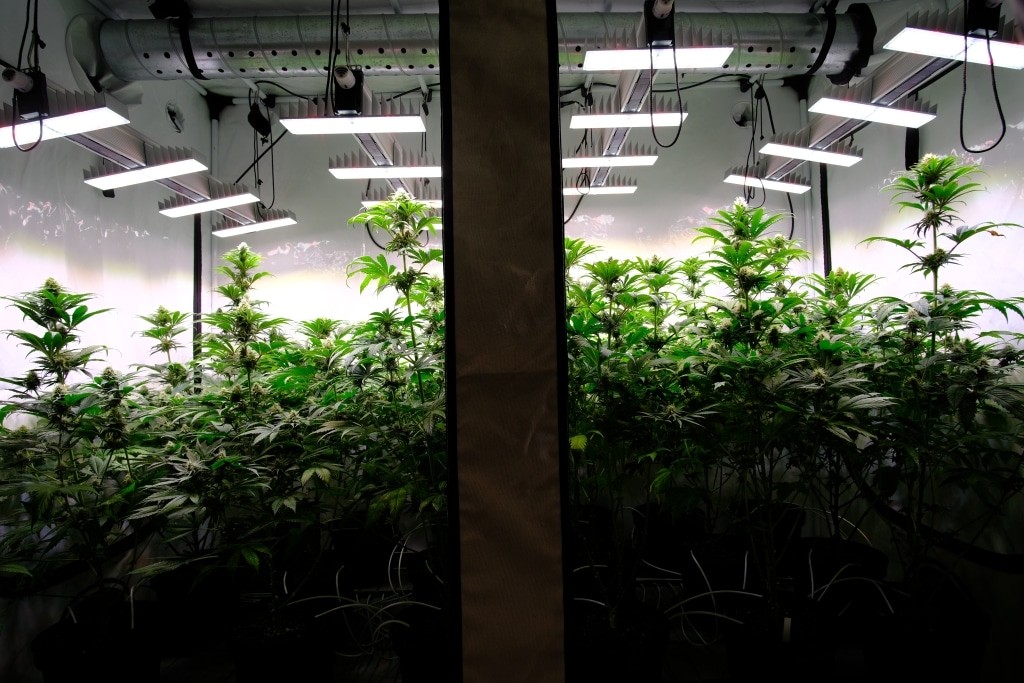
Documentation day 58 - 64. 6th week of flowering
Exposure time: 12 hours daily
Ø PPFDe
Tent 1 1.100µmol/m²/s
Tent 2 880µmol/m²/s
Tent 3 700µmol/m²/s
DLI
Tent 1 47.52mol/m²/d
Tent 2 38.01mol/m²/d
Tent 3 30,24mol/m²/d
Temperature: 26°C Room humidity: 55%.
Budding continues to progress.
Bleaching also progresses as flower growth increases.
The flowers are noticeably increasing in mass.
The plants get a daily water amount of 1.300ml per plant.
Watering is an EC value of 1.7 with a pH value of 5.8
Documentation day 78 - 84. 9th flowering week
Exposure time: 12 hours per day
Ø PPFDe
Tent 1 1.100µmol/m²/s
Tent 2 880µmol/m²/s
Tent 3 700µmol/m²/s
DLI
Tent 1 47.52mol/m²/d
Tent 2 38.01mol/m²/d
Tent 3 30,24mol/m²/d
Temperature: 26°C Room humidity: 55%
The ripening phase of the plants has started and the developed flowers begin to bulk up.
Bleaching no longer occurs on new plants. The fragrance in the grow room becomes more intense.
The plants receive a daily water amount of 900ml.
Fertilization has reached its peak and the plants receive an EC of 1.7 with a pH of 5.9 for this last week.
Documentation day 92 - 98. 11th flowering week
Exposure time: 12 hours per day
Ø PPFDe
Tent 1 1.100µmol/m²/s
Tent 2 880µmol/m²/s
Tent 3 700µmol/m²/s
DLI
Tent 1 47.52mol/m²/d
Tent 2 38.01mol/m²/d
Tent 3 30,24mol/m²/d
Temperature: 26°C Room humidity: 45%
This is the last flowering week for the plants and the room smells very intense.
Flower development is very good down to the lower parts of the plants
The ripening stage is well advanced and the plants are ready for harvest.
By skipping fertilization, the plants have noticeably lost color and the leaves have turned autumnal.
The plants are getting very little water at 500ml per day per plant and are being forced to dry out.
The EC value this week is 0.4 and the pH 5.8.
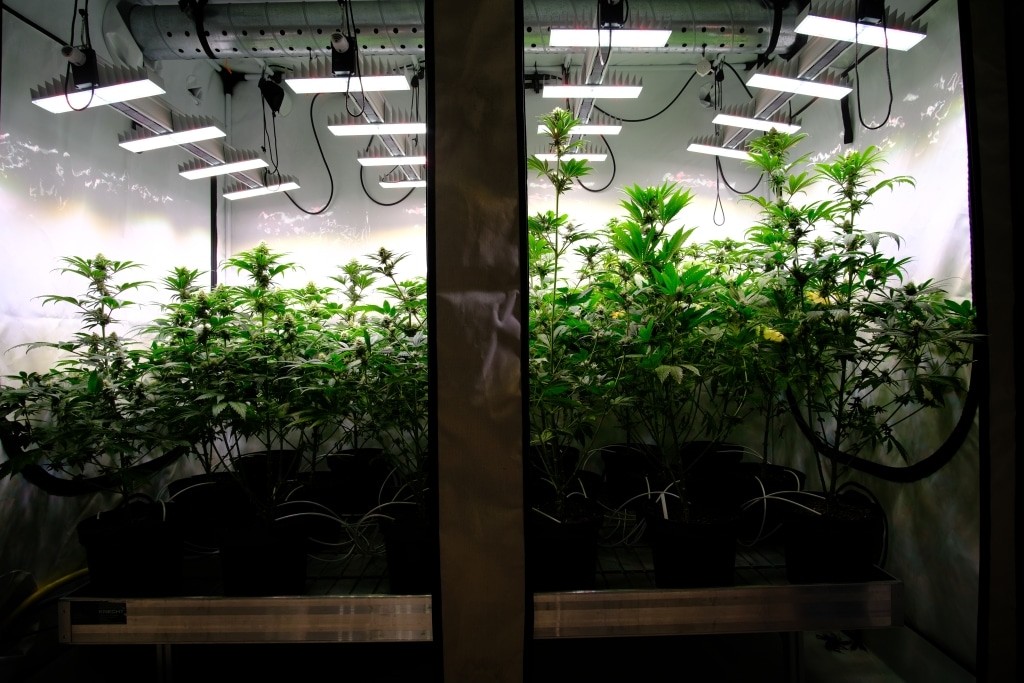
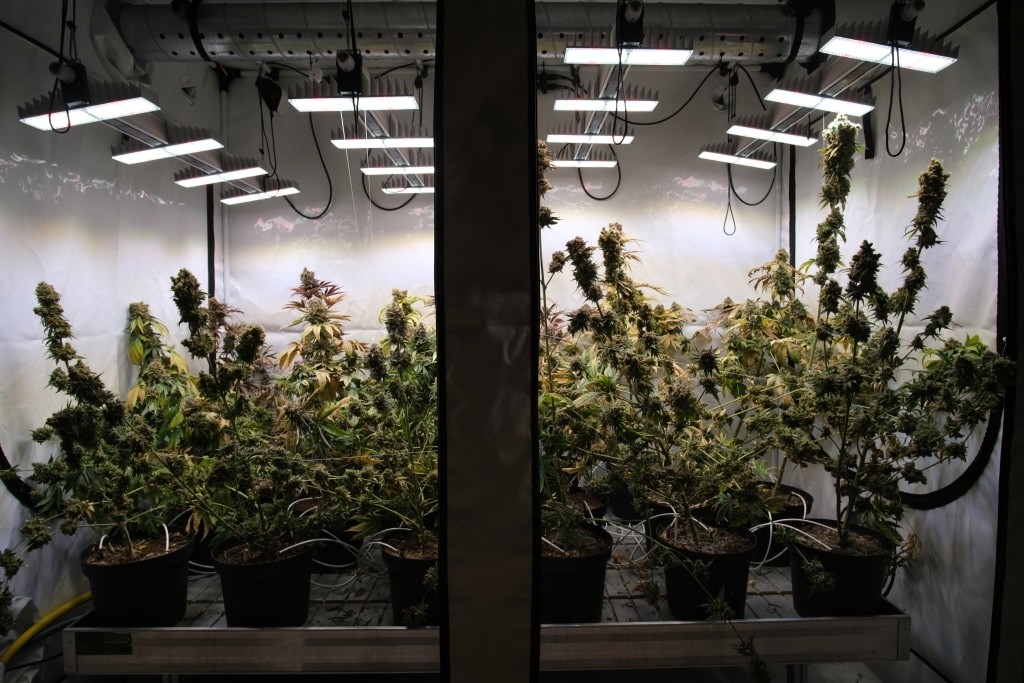
Harvest
The day before harvest, the plants were no longer watered, in order to deprive the flowers of as much water as possible.
On the day of harvest, all large fan leaves were removed from the plants still standing.
After removing the fan leaves, the plants were cut at pot height and the flowers were separated from the stem.
Subsequently, the flowers were freed from their petals and the flowers were hung to dry.
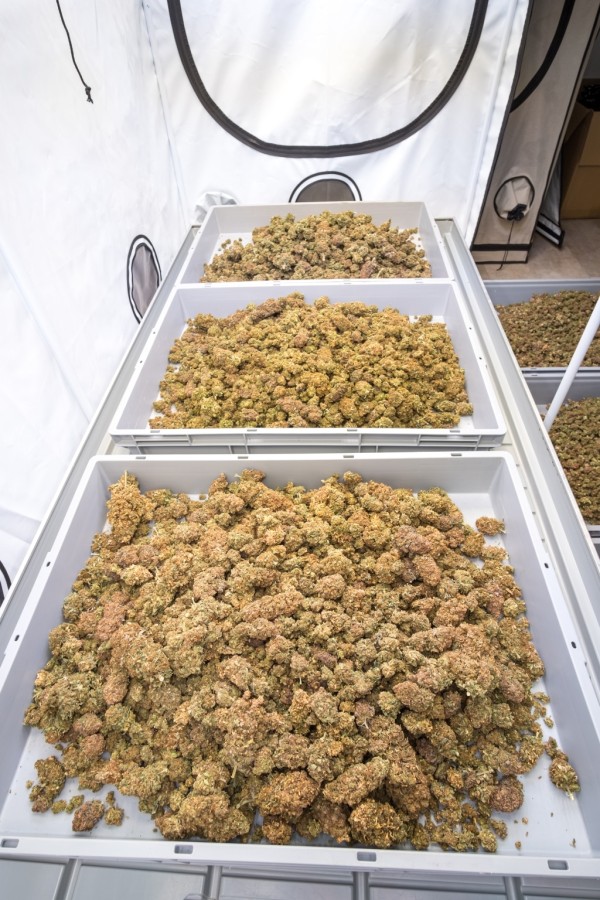
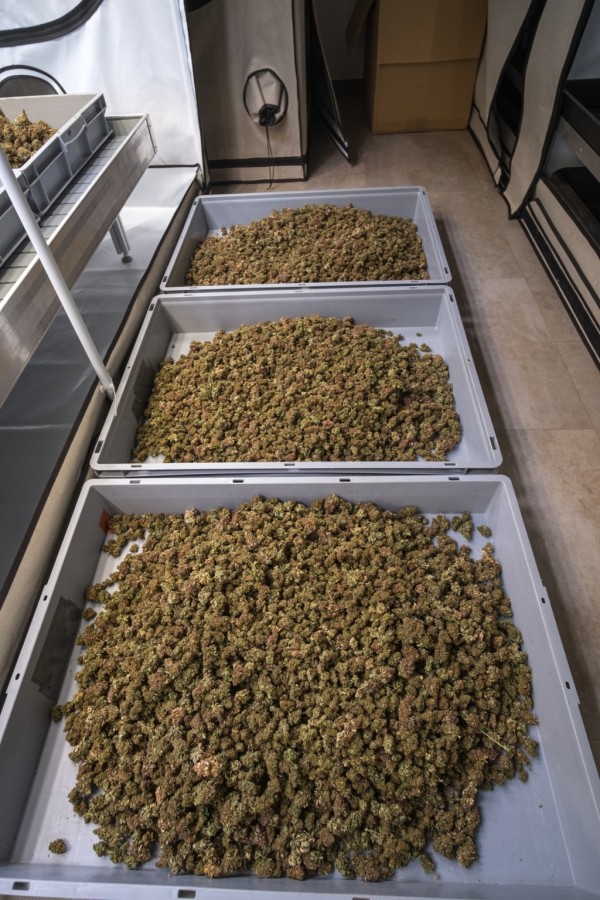
Harvest
After successful flowering phase, the harvest of the hemp plants took place. The plants were first cut off whole and dried. Subsequently, the flowers were separated from the plant. The dry flowers were then trimmed by machine. Subsequently, the flowers were then finally dried at 20°C and 55% humidity. The flowers were sorted according to size (large and small flowers), and weighed.
Results
With the SANlight EVO series, exposure intensities >1.000µmol/m²/s lead to an increase in yield per area, but reduce the yield/performance ratio by up to 26%.
Further, this trial demonstrates the superior performance of our EVO-series. Even when operating the lights at only 80% of their power, yields well above 500g/m² are achievable and more than 2g of flower mass can be produced per watt.
From an economic point of view, the use of the EVO 4-120 is absolutely recommendable, and a reasonable compromise between performance and economy.
To confirm the results, this trial will be repeated and published again on our webpage in a few weeks.
Further trials will follow.

M-Dimmer EVO-Series
M-Dimmer for the EVO-Series. Attention: does not fit the Q-Series.
€29,64 / Piece")


